The tipa /scallop population in the Hauraki Gulf Marine Park (HGMP) is on the verge of collapse due to mismanagement by Fisheries New Zealand (FNZ). The current population is one fifth of what it was in 2012 (when they last surveyed the beds). Huge cuts are needed to save the population, most of us will experience the loss in the supermarket or the boat ramp. Here are the things they did wrong (many by their own admission).
FNZ allowed fishing methods that destroy habitat. Bottom impact fishing is irresponsible because it destroys the habitats of target species. When you kill the animal and its home a new animal is less likely to be there the second time you go hunting there. “Dredge fishing is known to have negative impacts on scallop growth, populations and the habitat that supports them” – FNZ 2021. Juvenile scallops thrown back overboard by dredge fishers (bycatch) also have a high mortality rate.
FNZ relied on self regulation. Instead of doing tipa bed surveys they relied on:
Industry self-regulation which hid declines at individual beds (the scheme is called voluntary Catch Per Unit Effort). The average catch limit for the last decade was more than double what was actually landed.
Estimates of recreational catch based on boat ramp inspections. Commercial fishing is not the only problem here, 3/4 recreational only fished beds have collapsed.
Cameras on commercial boats (which can match catch with location) and mandatory recreational catch reporting would enable finer scale regulation and stop this happening to other fish populations.
FNZ didn’t do any spatial planing. They set no areas aside as nurseries for juvenile shellfish. “It would be logical to close some scallop beds and create passive restoration (broodstock areas) to increase the fishery yield” – Dr Mark Morrison, Shellfish Restoration Co-ordination Group, December 2021. FNZ even let bottom trawlers drag their nets over tipa beds damaging both adults and juveniles and leaving them vulnerable to predation and disease. A bed that was discovered in 2011 (Hauraki bed) was fished to collapse by 2014. This bed may well have been the nursery that propped up the already declining population. FNZ (and other governing bodies) hand picked ideas from the only integrated management plan devised for the Gulf (Sea Change 2017) which planned to phase out bottom impact fishing and addressed other impacts like sediment.
FNZ didn’t take a precautionary approach. FNZ should not have to rely on iwi calling a rāhui to stop a population collapsing. No one is paying iwi to sustainably manage fisheries. The two rāhui approved under section 186A of the fisheries act were already too late to save the population but they should have been actioned much faster. Variability in the tipa population trends gave FNZ gamblers confidence and they played the fishery like a slot machine.
You can read the report that recommends closing the fishery here. I will be supporting a full closure and recommending a discontinuation of the four irresponsible behaviours. I hope that all the tipa beds recover from the closure but it’s likely many of them will not. We have recently seen this in SCA7 Golden Bay, SCA7 Tasman Bay where the FNZ collapsed the fishery, and in three individual beds (Ponui-Wilsons, Shoe-Slipper, Barrier & Kawau) in the SCA CS fishery (HGMP). Enabling the long-term damage of a habitat forming species is not just fisheries collapse or functional extinction – it’s ecocide.
Note this paper recommends eliminating bottom contact fishing is the most effective intervention to rebuild a depleted scallop populations in New Zealand
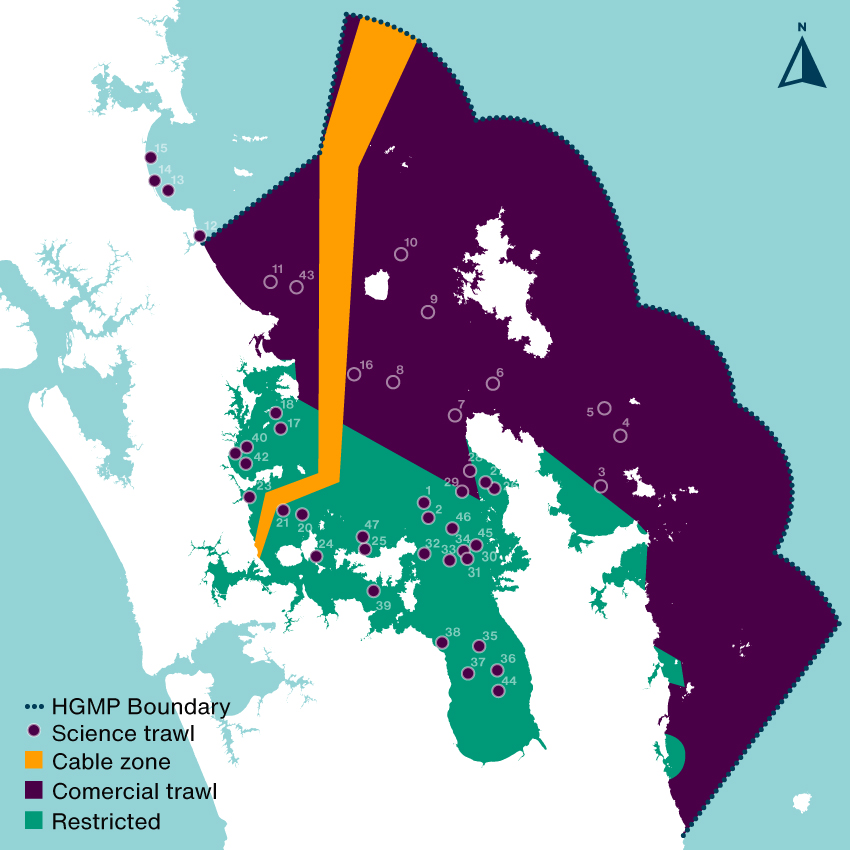
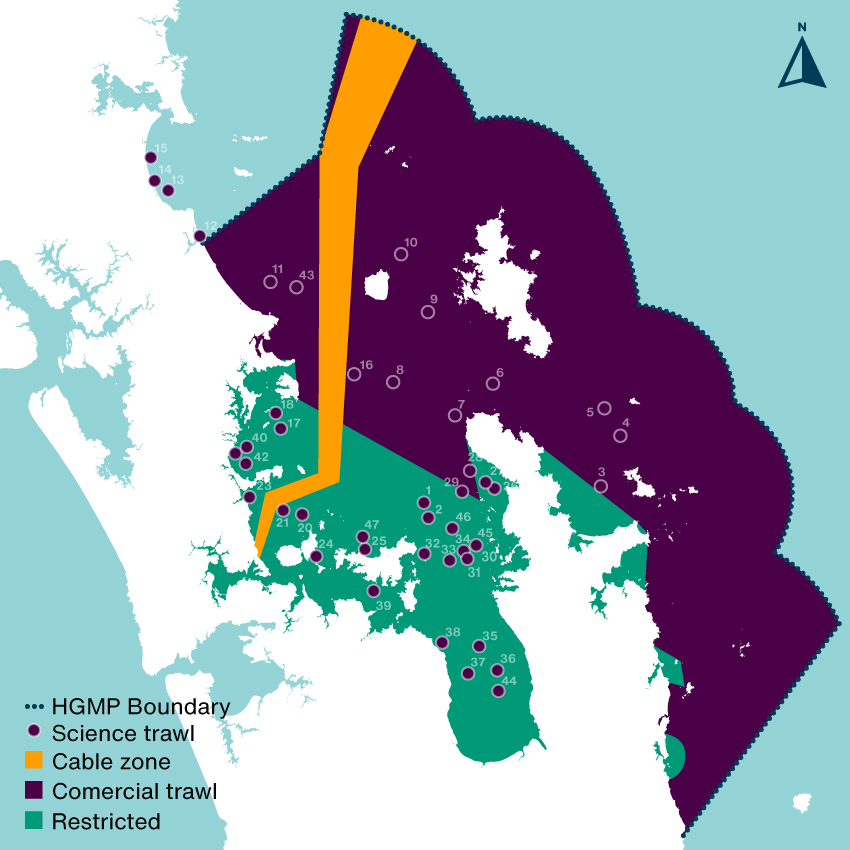
The most barbaric way to answer this question would be to drag a giant net around and count what you kill but you’re not allowed to do that in the inner Gulf where trawling is restricted… unless you have a research permit from Fisheries New Zealand (FNZ). Despite calls to stop bottom trawling in the Hauraki Gulf Marine Park (HGMP) (Sea Change 2017 & Hauraki Gulf Forum 2021) FNZ have started doing these trawls regularly, they justify the trawls are required to gather information on the Tāmure / Snapper population. They haven’t done research trawls like this since the Hauraki Gulf Marine Park Act came into effect in the year 2000 (NIWA 2019). In areas where trawling is restricted (c25% of the HGMP), the study was like bulldozing a regenerating forest to count the birds. A disgraceful act on private land let alone a national park.
How much seafloor was scraped?
The nets are massive, wider than a rugby field. FNZ were just interested in killing demersal fish (goundfish), they dragged theses massive nets along the seafloor smashing down anything that lives there and creating giant sediment plumes that contribute to climate change. In areas that have been closed to trawling for decades there are patches of horse mussel beds, sponge gardens and tubeworm mounds and other habitats regenerating after decades of abuse from heavy machinery. You can read about them in the report (NZFAR 2021) where they are described as ‘foul’ a horrible word which suggests there is something ugly about these beautiful benthic epifauna that are working hard (day and night) to clean up our pollution (they are nearly all filter feeding animals). In defense of FNZ they did try and avoid areas with a lot of immobile sea life but they failed so badly that they had to stop trawling on several occasions, this shows that a) the seafloor is recovering and b) echosound is no good for measuring trawling impact on benthic life.
Although the percent of trawled seafloor was small (less than 1% of the study area) the areas bottom trawled were huge:
39 rugby fields between Shakespear Regional Park and Rangitoto Island
Stratum 1386
54 rugby fields of the inner Firth of Thames
Stratum 1887
68 rugby fields of the mid Firth of Thames
Stratum 1268
88 rugby fields in a west-east band North of Waiheke Island
Stratum 2229
59 rugby fields around the western side of Waiheke Island
Stratum 1149
41 rugby fields north of Whangaparāoa Peninsula
Stratum 1284
40 rugby fields northwest Coromandel
Stratum 9292
60 rugby fields south of the line dividing the inner gulf
Stratum 1219
59 rugby fields from Bream Bay to Mangawhai
Stratum 1449
49 rugby fields between Aotea / Great Barrier Island and Ahuahu / Great Mercury Island
Stratum COLV
77 rugby fields north of the line dividing the inner gulf
Stratum LITB
A total of 615 rugby fields, 381 of those fields had not been physically impacted by trawling for decades. The trawls were about 1/10th as long as a commercial trawl which may impact 1–10 km2 (MacDiarmid 2012). This is largely due to the horrific sediment plumes they create, especially on mud which most of the trawls in restricted areas were. This means the total trawl distance of 53.35km could have impacted up to 40km2 (6,349 rugby fields) of seafloor – choking animals and smothering plants.
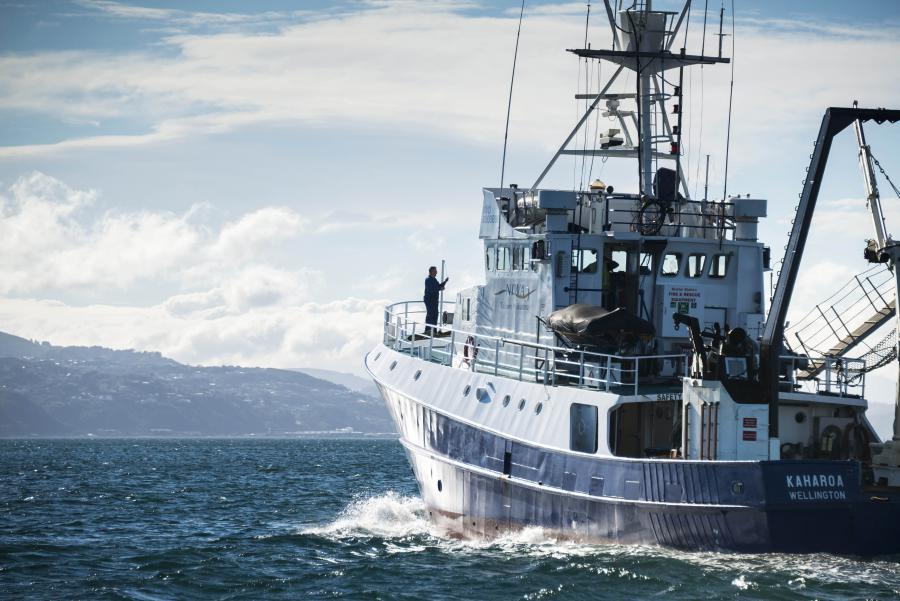
The research trawler Kaharoa. Photo by Dave Allen (NIWA).
So where were all the fish?
The average catch weight per trawling station in restricted areas was 500% higher than areas where bottom trawling is not restricted (1,033kgs vs only 171kgs). That’s a huge difference, the commercial fishers pulling up the nets must have been blown away with the haul! There was no significant difference in the size of the trawls but there was a big difference in depth. Trawls in trawling restricted areas averaged about half the depth (23m) of those in regularly trawled areas (47m). So are the fish benefiting more from trawling restrictions or depth?
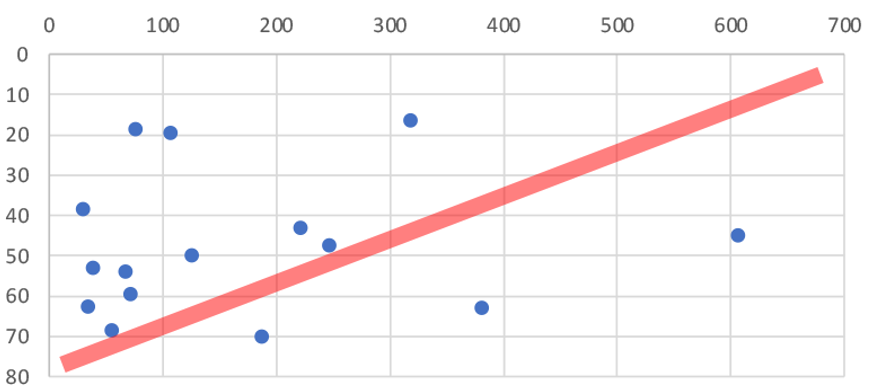
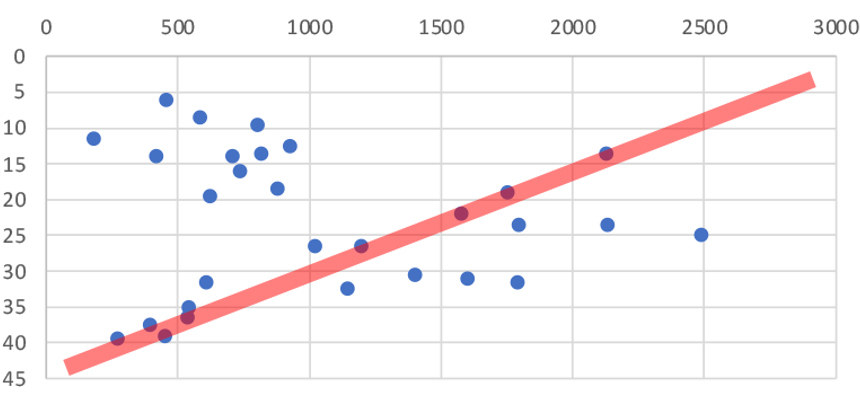
Figure 1. Catch weight per station by depth in trawled areas. The red line predicts catch weight going down in deeper areas.Figure 2. Catch weight per station by depth in areas where trawling is restricted. The red line predicts catch weight going down in deeper areas.
As you can see from Figure 1 & 2 there is no correlation between depth and catch weight (red line vs data). There could be many other factors involved (FNZ seemed to deliberately avoid trawling on sand in the inner Gulf so we can not directly compare substrates), but the 500% increase in catch weight in areas protected from trawling shows that protecting the seafloor from bottom trawling dramatically increases the amount of fish that live on the seafloor.
The survey is good news for recreational fishers who shouldn’t leave the inner Gulf to catch more Tāmure / Snapper. If you’re a fisher who wants to know where demersal fish are in the Gulf I recommend you read the report (NZFAR 2021). If you want to know which trawling station got the highest catch… I’m not telling! You will have to ask FNZ, you can send them an OIA request Official.InformationAct@mpi.govt.nz why don’t you tell them to stay out of the restricted areas and stop bottom impact fishing at the same time 😀
What happened to all the fish?
The total weight of fish (mostly Tāmure / Snapper) landed was 41,759 kilograms! 80% of the dead fish was sold for $128,449.35 which seems like a lot but with Tāmure at $20-$30 per kg at the supermarket they could have made more than one million dollars selling it direct to consumers. Of the total revenue from the two years of survey approximately 73% ($93,634.47) was absorbed in operation costs of the research vessel to process the catch. The remaining balance ($34,814.88) was returned to the Ministry of Primary Industry. That means even selling the dead fish dirt cheap the surveys make a profit for the Government. The self issued scientific permit to trawl in restricted areas is more profitable than some whaling trips the Japanese government justifies as science.
What else did they haul up?
I was surprised to see invasive species like Mediterranean fanworm (Sabella spallanzanii) turning up in the catch. They are very skinny and should fly through the nets. There must have been very dense beds in places. It was disappointing to hear from my Official Information Act request that Biosecurity New Zealand was not informed of which stations had high numbers of the Unwanted Organism. The lack of interagency communication (even with MPI) sucks but the double standard is worse. When restoring the seafloor from fishing damage the Mussel Reef Restoration Trust must notify an MPI technical officer if it accidentally releases an Unwanted Organism (a legal requirement of moving Unwanted Organisms under the Biosecurity Act 1993). Bottom trawlers however can move them around the Gulf with no regard to Biosecurity. This shows how Biosecurity NZ favours industry over community groups.
Will they do it again?
The surveys continue despite FNZ no longer having a public license to bottom trawl the HGMP. There is 84% public opposition to fishing methods that impact the seafloor (Hauraki Gulf Forum 2021). Most fisheries scientists take samples 100’s of times smaller or use baited underwater video cameras to count and measure fish. FNZ definitely don’t have a social license to trawl in restricted areas but they are ploughing on. Because I make a living doing science communication its not in my interests to criticise the research survey but I had to because I think what they are doing is wrong.
Notes
I included trawl stations in areas where Danish seining is allowed and trawling is restricted in the restricted totals. The three stations had an average catch weight that lowered the average restricted catch weight and increased the average catch depth.
References
Sea Change 2017. Sea Change – Tai Timu Tai Pari Marine Spatial Plan. Hauraki Gulf Forum, Ministry for Primary Industries, Department of Conservation, Waikato Regional Council, Auckland Council. 2017.
MacDiarmid 2012. Assessment of anthropogenic threats to New Zealand marine habitats. A. MacDiarmid. New Zealand Aquatic Environment and Biodiversity Report No. 93 2012
I have illustrated most of the mobile animals you might see on a protected shallow reef in North Eastern New Zealand. It’s available as a canvas print, framed art print, metal print, photographic print and poster on Redbubble.com
If you buy one please send me a photo so I can see how it looks, below is the large poster in semi gloss. I was really pleased with the result and will stick it on the wall by my dive gear.
Here are a few closeups.
All my profits from the sale of the work will go toward marine protection initiatives in New Zealand.
Commercial bottom trawling and Danish seining. The Sea Change – Tai Timu Tai Pari Marine Spatial Plan 2016 (Sea Change) recommend these fishing methods be removed from the Gulf, this is inline with the Hauraki Gulf Forums (The Forum) goals. It is disappointing to see the Government push any decision to another committee, however they have suggested ‘most’ trawling will stop which is hopeful. Currently both practices impact about 77% of the Gulf.
Commercial dredging. Sea Change and the Forum also recommend this destructive practice be removed from the Gulf. No changes here with huge heavy machines scraping ~37% of the seafloor. In 2016 current Minister of Oceans David Parker said “Fisheries New Zealand has been captured by industry” it seems that has not changed with Mr Parker now heading up the portfolio. I am hoping the areas are reduced in the Fisheries Management Plan as most of the effort (~300 tows PA) currently happens around the Mercury Island Group.
Recreational dredging. Stopping this is a huge win for the Gulf, it opens up the entire Inner Gulf for restoration and I think it should have been the headline. However I think its unlikely that recreational fishers will think this is fair given commercial dredges have much more impact on the seafloor. The Inner Gulf is much more degraded by bottom impact fishing than the Outer Gulf with over 122 years of scraping. It’s really exciting that from 2024 it can begin the long process of recovery.
Marine Protected Areas. No take marine reserves go from 0.33% to 0.575% of the Gulf. This is a significant increase, but a pathetic overall result. Experimental ‘High Protection Areas’ with customary take by permit will attempt to protect 6.2% of the Gulf. These areas will not come into effect until the end of 2024. I expect we will have to wait at least seven years before we know if they work.
Fisheries Management Plan. Also pushed to another committee. I am deeply concerned that the changes above will not arrest the decline of the Gulf especially with looming climate change impacts. The entire approach is relying heavily on the Fisheries Management Plan which they claim will be ecosystem based.
Here is some detail on the Marine Protection Areas
Existing ‘No Take’ Marine Protected Areas in the Gulf:
Cape Rodney-Okakari Point Marine Reserve
5.6km2
Te Whanganui A Hei (Cathedral Cove) Marine Reserve
8.8km2
Long Bay-Okura Marine Reserve
9.6km2
Motu-Manawa-Pollen Island Marine Reserve
5km2
Te Matuku Marine Reserve
6.9km2
Tāwharanui Marine Reserve
4km2
TOTAL
39.9km22
Sea Change ‘No Take’ extensions
Whanganui-a-Hei (Cathedral Cove) Marine Reserve
+15 km2
Cape Rodney-Okakari Point (Leigh) Marine Reserve
+14 km2
TOTAL
29km2
The Hauraki Gulf Marine Park is 12,000km2 or 14,000 km2 of ocean depending on what you read, I’m choosing the smaller number.
Sea Change brings ‘No Take’ Marine Protection in the Gulf from 40km2 to 69km2 or from 0.33% to 0.575%.
The other 11 proposed High Protection areas are experimental in that they allow customary take by permit. They could meet the protection level required to be designated as MPAs, depending on how mana whenua choose to undertake their customary practises. They are:
Te Hauturu-o-Toi/Little Barrier Island
195.4km2
Slipper Island/Whakahau
13.5km2
Motukawao Group
29.1km2
Firth of Thames and Rotoroa Island
12.4 km2
Rangitoto Island and Motutapu Island
10.7km2
Cape Colville
26.7 km2
Mokohinau Islands
118.5km2
Aldermen Islands
133.9 km2
Aldermen Islands South
155.0 km2
Kawau Bay
40.4 km2
Tiritiri Matangi Island
9.5 km2
TOTAL
745.1km2
Or 6.2% of the Gulf.
The technical analysis of the proposals has assumed that these areas will be ’No Take’ but Government has decided to use special legislation to progress the ‘High Protection Areas’ rather than the Marine Reserves Act, there is no indication as to why. The areas which will be enabled through new legislation which will not be passed until 2024, this means the process which started in 2013 when completed will have taken 11 years. As the areas include customary take by permit, they are experimental. I don’t know how long we will then have to wait until we know if the experiment works or not. I am deeply concerned it’s not even close to enough protection to restore functioning ecosystems in the Gulf. The existing reserves and extensions plus the High Protection Areas only add up to 6.775% of the Gulf (excluding any seafloor protection like cable zones). The Government is putting a lot of faith in a Fisheries Management Plan that does not yet exist.
Errors (as I find them):
Page 39. “Since then, large scallop and oyster beds have largely replaced mussel beds in areas of habitat degradation.” The areas are dominated by mud, invasive species are the dominant epifauna.
Page 39. “Significantly increasing the amount of freshwater” sentence is not finished or doesn’t make sense.
Page 107. Climate change resilience excluded from Draft Fisheries Management Plan. Incredible that in 2021 a Govt department can still make a plan that excludes known climate change impacts.
UPDATE 23 July: MAC report released
The Ministerial Advisory Committee was not impressed with the first draft of the action plan, and it looks like many changes were made. However it is hard to tell what was changed as (like the action plan itself) it is very short on detail. The biggest criticism seems to be on the timings which I really agree with, Govt is moving incredibly slowly given the urgency of the problem.
The other general criticism is around resourcing. This paragraph well articulates my frustration in reading the ‘active restoration’ section of the report.
“Our major concern with this part of the strategy is a complete lack of reference to funding sources for restoration. While identifying regulatory barriers is mentioned, there is no mention of funding barriers, which are arguably just as significant. Active restoration efforts will require resources to implement and sources of funding should be identified.”
I am very pleased to see that Govt listened to one member of the MAC that questioned blanket customary take in the MPAs. I hope many iwi will support no-take in HPAs because they will want them to have maximum mauri, and only no-take MPAs are known to work – anything else is an experiment.
A lot of the rest of the criticism is around governance. I am not interested in ownership of the Gulf or the power dynamics… just environmental outcomes.
UPDATE 30 July: OIA on dredging areas refused
OIA response here. I have emailed the officer to ask for the survey results and a follow up meeting.
UPDATE 6 August 2022:
I got no response, so sent in a new OIA request for the data and survey. I then got a phone call. They are 6-8 weeks away from publishing the NIWA HGMP scallop fishery survey results (so my request for those will be declined). Aggregated Electronic Catch and Position Reporting (ER/GPR) data would be available if I provided a specific time frame and area. The data could be provided visually E.g. a heat map. I have done this.
I was also informed that the conversation around management options for the scallop fisheries is internal, management options will not be made public but will be provided to the Minister in several months.
UPDATE 6 September 2022
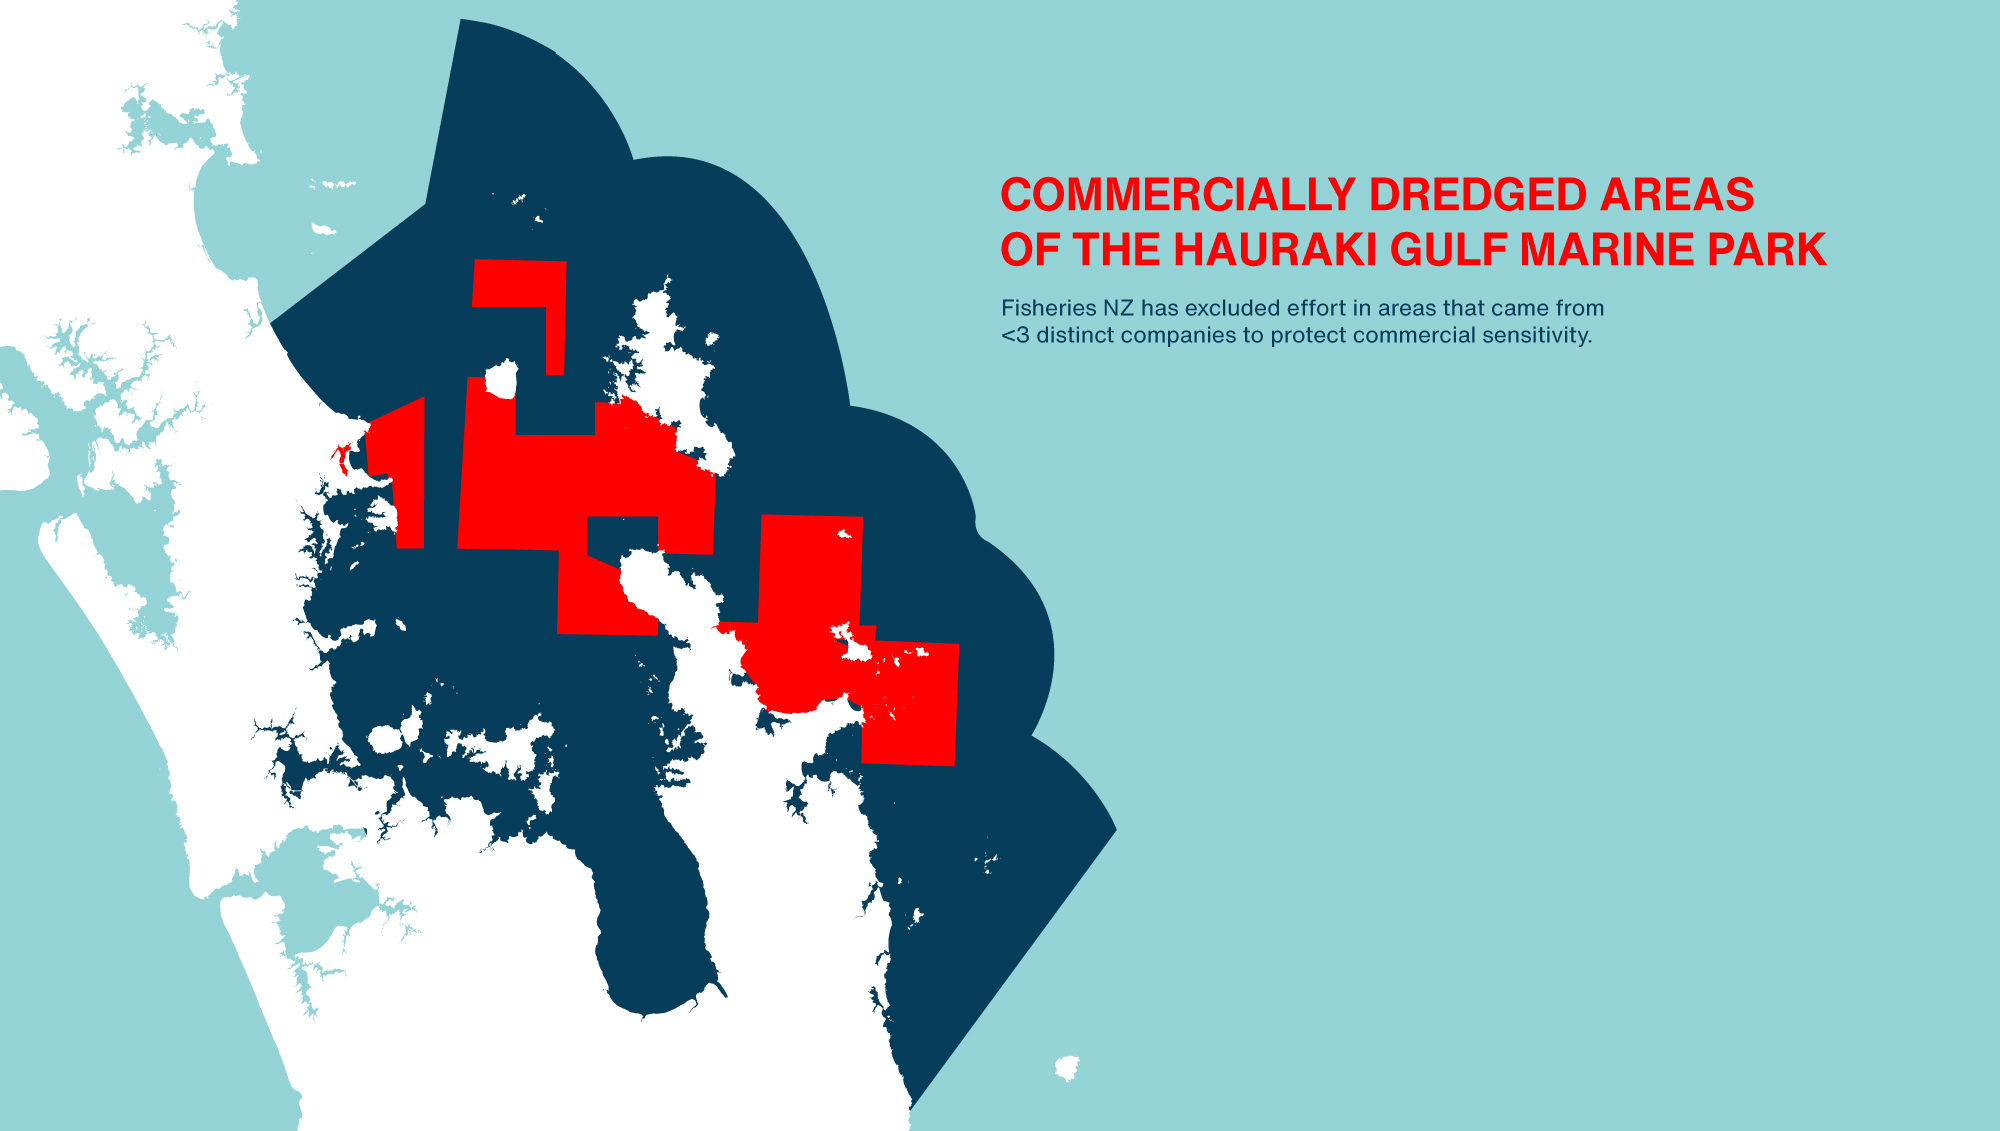
I received a response to my OIA request (Heatmap A, Heatmap B). I have added the dredged areas together and removed the proposed HPA’s, SPA’s and CPZ’s to calculate the percent of the HGMP that will be ‘frozen’ under the Governments plan to ‘revitalise the Gulf‘. More than 20% of the Gulf will remain heavily impacted by commercial dredging with no public input into the decision.
Update 28 September 2022:
The cost to create $774.1km2 of Marine Protection Areas in the plan (assuming they are no-take) to 11 commercial fish species was calculated to be $3,436,014. If we crudely scale up the figure for the gains to snapper / tamure alone based on this paper we get $209,710,000. Or a net gain of more than 200 million dollars! This is an incredible number, MPAs would not be adding so much money to commercial fisheries if they did not manage fish levels at such incredibly low numbers. Clearly Fisheries New Zealand should be making MPAs (at speed) all around NZ.
While researching my latest nature report to the Tahuna Torea Residents and Rangers I found some great bird counts in the reserve made in the 1980’s that had been entered on eBird. Unfortunately an oversight in the design of the website means you need to know a statistical programming language to extract population trend data for a location (however if you are able to stumble across an old checklist you can download the data). At the meeting Chris Barfoot supplied me with a brilliant 1993 report on the reserve which had a new set of data recorded by Micheal Taylor.
UPDATE 23 JUNE 2021. Here is an interesting snippet of history complied by the Howick & Pakuranga Times “Kuaka [bar tailed godwits] and red knots gather on the Cockle Bay estuary in thousands before flying to Korea and on to Alaska to breed each March, to return in September. In February-March they swoop over Point View ridges where farmers used shotguns before the birds were protected in 1941. They were plucked and preserved in their fat in ceramic jars.” Source: https://www.birdingnz.net/forum/viewtopic.php?f=3&t=11024
UPDATE August 2021. More data found in old journals. Graphs updated and presented to the Ōrākei Local Board.
I have begun doing some work with the Northern New Zealand Seabird Trust who invited me to come and help them with some field work on the Poor Knights Islands. My father had visited the Islands when he worked for DOC in the 1990’s, his stories about the reptile abundance really inspired me to do restoration work, and I jumped at the opportunity to go.
Landing on the Island is notoriously difficult and our first shot at it was delayed, we had to go back to Auckland to wait for better weather. The islands are surrounded by steep cliffs that made European habitation impractical, Māori left the area in the 1820’s. This means the island I visited has never had introduced mammals, not even kiore! I spent days cleaning my gear to get through the biosecurity requirements which are incredibly strict for good reason.
I have explored a few predator free islands including Hauturu / Little Barrier Island which has been described as New Zealand’s most intact ecosystem. However it was only cleared of rats in 2004. When I am photographing invertebrates at night in mainland sanctuaries or forests with predator control (like Tāwharanui Regional Park or parts of the Waitakere Ranges) I see one reptile every eight hours or so. On Hauturu / Little Barrier Island I see them every 20 minutes, but on the Poor Knights it was every two minutes! Bushbird numbers were lower than other islands, I expect this is because reptiles and birds compete over prey species. I wonder if reptile numbers on other islands might be slower to recover because they are preyed on by bushbirds. I reckon that the Poor Knights total reptile and bushbird biomass is much greater than the restored islands I have visited. One reason for this is that reptiles use less energy to hunt than bushbirds but the other reason might be because it has more seabirds.
While walking through the bush at night I would sometimes hear a crashing in the canopy followed by a soft thump on the ground. In an incredible navigational feat the seabirds somehow land only meters from their burrows. At night I heard Buller’s shearwater, grey-faced petrel, little penguins and diving petrel (fairy prion finish breeding in February). While monitoring birds at night I was showered with dirt by a Buller’s shearwater who was digging out a burrow. In my short time on the island I saw cave weta and three species of reptile using the burrows. Like a rock forest the burrows add another layer of habitat to the ecosystem. It was incredibly touching to see the care and compassion the researchers had for some of the chicks who were starving while waiting for their parents who often have to travel hundreds of kilometres to find enough food. The chicks who don’t make it die in their burrows and are eaten by many invertebrates, the invertebrates in turn become reptile or bushbird food. The soil on the island looked thick and rich, when it rains nutrients are bought down into the small but famous marine reserve which is teaming with life.
I was only on the island for three nights but I was very fortunate to experience a pristine ridge to reef ecosystem. Seabirds are incredible ecosystem engineers who were an integral part of New Zealand’s inland forests for millions of years. Communities are making small efforts to bring seabirds back to predator free island and mainland sites with no control over seabird food sources. If we really want intact ecosystems we will have to make sure our oceans have enough food for seabirds to feed our forests.
For the last eight years I have been working on restoring green-lipped mussel (perna canaliculus) beds in the Hauraki Gulf. The main reason we started with that species was that there is a commercial supply. However there is a bigger native mussel that has even more potential than green-lipped mussels, both as a habitat and water cleaner.
Horse mussels / Hururoa (atrina zelandica) are huge pumps, they are more than twice as big as green-lipped mussels (up to 400 mm in length) but have fragile shells which are vulnerable to fishing gear. They also don’t move (unliked green-lipped mussels) and are sensitive to changes in substrate.
Last century horse mussel beds were some of the best fishing spots in the Hauraki Gulf. I regularly ask divers about horse mussels; Where did you see them? How dense was the bed? etc. There are spots with horse mussel in the Gulf but I don’t know of any significant beds left, if you do, please let me know about them.
I was recently sent these images of a stunning horse mussel bed in Pakiri. They are from a report titled “Mangawhai – Pakiri Sand Study, Module 2: Technical Report, Marine Sands” by NIWA 1996. They show a large and dense horse mussel bed that has since been destroyed by sand mining. The beds ran the whole length of the embayment in depths of 15 -20m. I am posting them here to show the kind of seafloor we could have, if we treated it better.
We don’t yet understand the horse mussel lifecycle or what species / substates might attract juveniles. It’s interesting to note: presence of finger sponge and branching red algae, the hard edge to the bed and the way some of the shells align.
Overseas there have been attempts at restoring similar species (photos below). Seachange called for the “Initiation of a horse mussel restoration programme, with an initial focus on the Mahurangi and Whangapoua harbours.” But we could look at restoring any of the sites with historic beds. Wouldn’t it be awesome if we stopped smashing the seafloor, and bought back these giant pumps to clean the water, and create homes for fish.