Where are all the fish in the Hauraki Gulf?

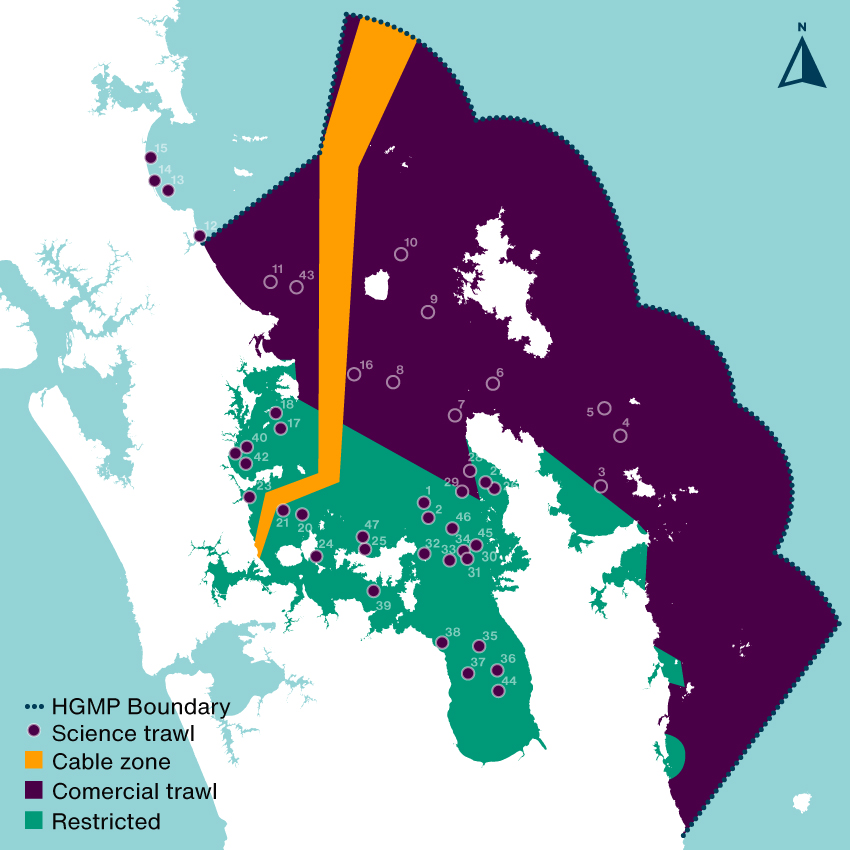
The most barbaric way to answer this question would be to drag a giant net around and count what you kill but you’re not allowed to do that in the inner Gulf where trawling is restricted… unless you have a research permit from Fisheries New Zealand (FNZ). Despite calls to stop bottom trawling in the Hauraki Gulf Marine Park (HGMP) (Sea Change 2017 & Hauraki Gulf Forum 2021) FNZ have started doing these trawls regularly, they justify the trawls are required to gather information on the Tāmure / Snapper population. They haven’t done research trawls like this since the Hauraki Gulf Marine Park Act came into effect in the year 2000 (NIWA 2019). In areas where trawling is restricted (c25% of the HGMP), the study was like bulldozing a regenerating forest to count the birds. A disgraceful act on private land let alone a national park.

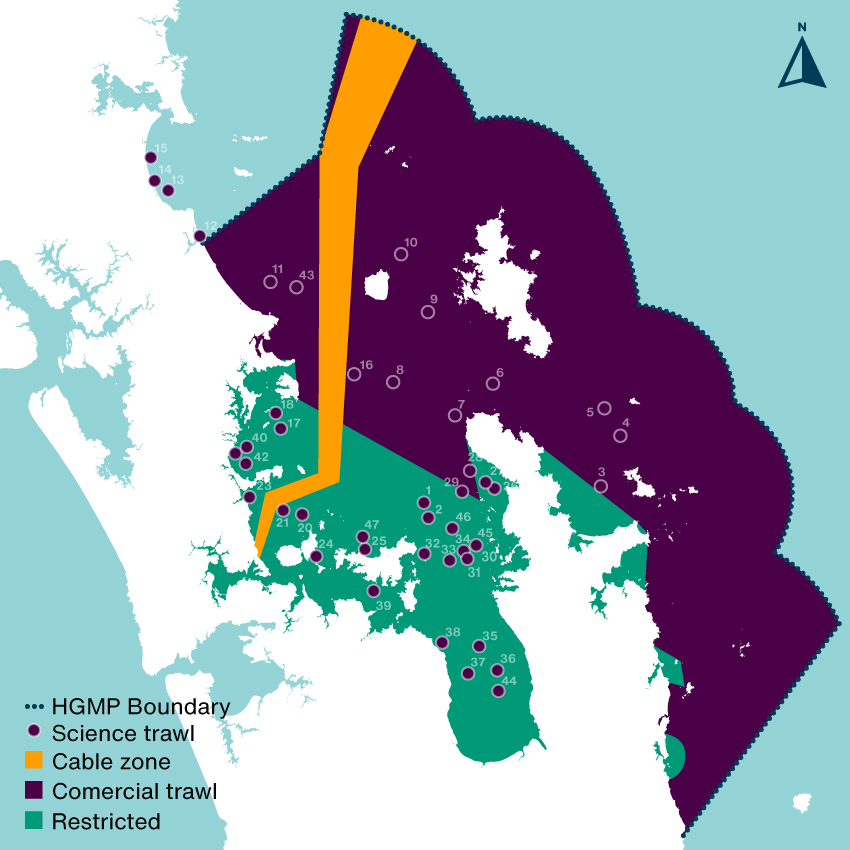
How much seafloor was scraped?

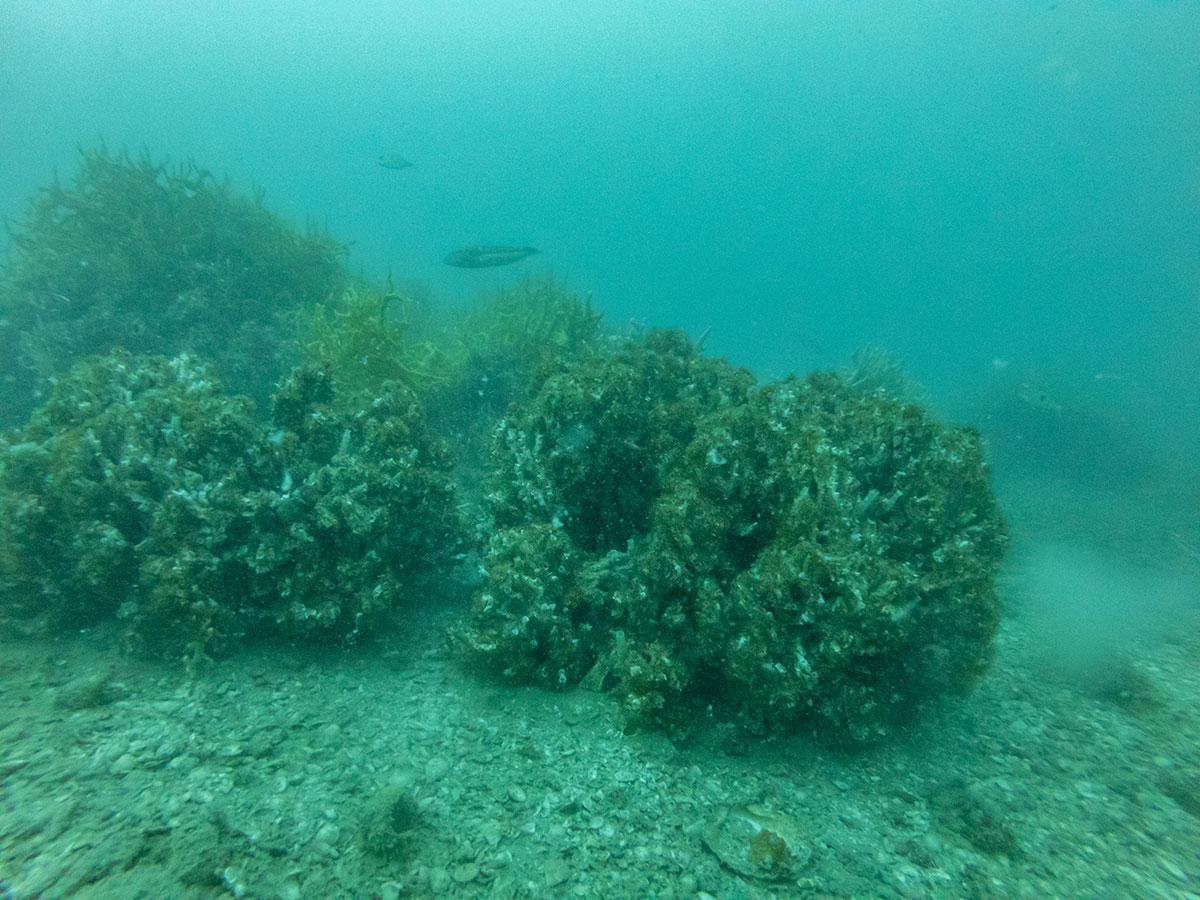
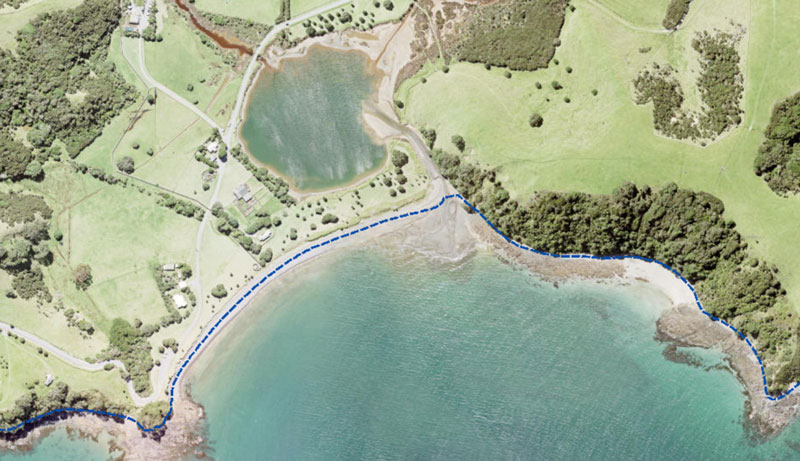
The nets are massive, wider than a rugby field. FNZ were just interested in killing demersal fish (goundfish), they dragged theses massive nets along the seafloor smashing down anything that lives there and creating giant sediment plumes that contribute to climate change. In areas that have been closed to trawling for decades there are patches of horse mussel beds, sponge gardens and tubeworm mounds and other habitats regenerating after decades of abuse from heavy machinery. You can read about them in the report (NZFAR 2021) where they are described as ‘foul’ a horrible word which suggests there is something ugly about these beautiful benthic epifauna that are working hard (day and night) to clean up our pollution (they are nearly all filter feeding animals). In defense of FNZ they did try and avoid areas with a lot of immobile sea life but they failed so badly that they had to stop trawling on several occasions, this shows that a) the seafloor is recovering and b) echosound is no good for measuring trawling impact on benthic life.

Although the percent of trawled seafloor was small (less than 1% of the study area) the areas bottom trawled were huge:

39 rugby fields between Shakespear Regional Park and Rangitoto IslandStratum 1386
54 rugby fields of the inner Firth of ThamesStratum 1887
68 rugby fields of the mid Firth of ThamesStratum 1268
88 rugby fields in a west-east band North of Waiheke IslandStratum 2229
59 rugby fields around the western side of Waiheke IslandStratum 1149
41 rugby fields north of Whangaparāoa PeninsulaStratum 1284
40 rugby fields northwest CoromandelStratum 9292
60 rugby fields south of the line dividing the inner gulfStratum 1219
59 rugby fields from Bream Bay to MangawhaiStratum 1449
49 rugby fields between Aotea / Great Barrier Island and Ahuahu / Great Mercury IslandStratum COLV
77 rugby fields north of the line dividing the inner gulfStratum LITB

A total of 615 rugby fields, 381 of those fields had not been physically impacted by trawling for decades. The trawls were about 1/10th as long as a commercial trawl which may impact 1–10 km2 (MacDiarmid 2012). This is largely due to the horrific sediment plumes they create, especially on mud which most of the trawls in restricted areas were. This means the total trawl distance of 53.35km could have impacted up to 40km2 (6,349 rugby fields) of seafloor – choking animals and smothering plants.

The research trawler Kaharoa. Photo by Dave Allen (NIWA).

So where were all the fish?

The average catch weight per trawling station in restricted areas was 500% higher than areas where bottom trawling is not restricted (1,033kgs vs only 171kgs). That’s a huge difference, the commercial fishers pulling up the nets must have been blown away with the haul! There was no significant difference in the size of the trawls but there was a big difference in depth. Trawls in trawling restricted areas averaged about half the depth (23m) of those in regularly trawled areas (47m). So are the fish benefiting more from trawling restrictions or depth?

Figure 1. Catch weight per station by depth in trawled areas. The red line predicts catch weight going down in deeper areas.
Figure 2. Catch weight per station by depth in areas where trawling is restricted. The red line predicts catch weight going down in deeper areas.

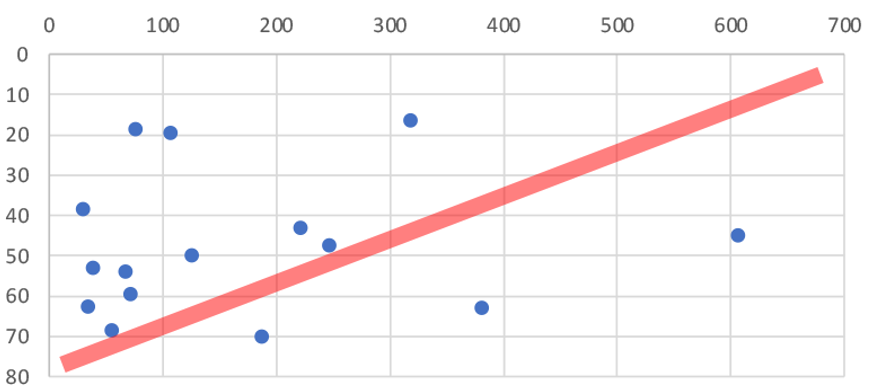
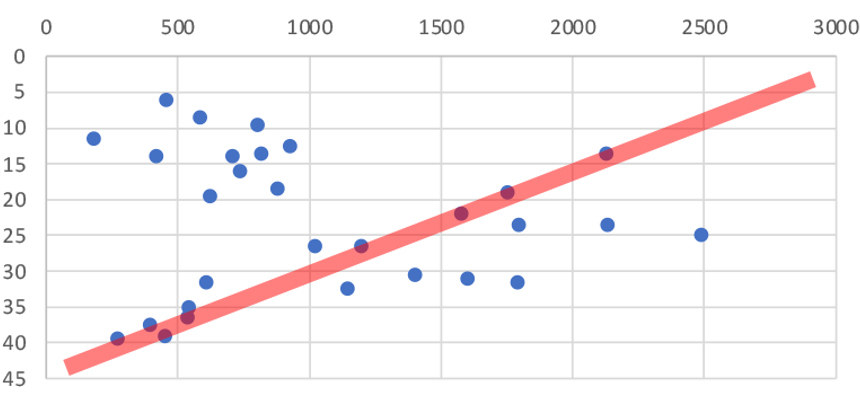
As you can see from Figure 1 & 2 there is no correlation between depth and catch weight (red line vs data). There could be many other factors involved (FNZ seemed to deliberately avoid trawling on sand in the inner Gulf so we can not directly compare substrates), but the 500% increase in catch weight in areas protected from trawling shows that protecting the seafloor from bottom trawling dramatically increases the amount of fish that live on the seafloor.

The survey is good news for recreational fishers who shouldn’t leave the inner Gulf to catch more Tāmure / Snapper. If you’re a fisher who wants to know where demersal fish are in the Gulf I recommend you read the report (NZFAR 2021). If you want to know which trawling station got the highest catch… I’m not telling! You will have to ask FNZ, you can send them an OIA request Official.InformationAct@mpi.govt.nz why don’t you tell them to stay out of the restricted areas and stop bottom impact fishing at the same time 😀

What happened to all the fish?

The total weight of fish (mostly Tāmure / Snapper) landed was 41,759 kilograms! 80% of the dead fish was sold for $128,449.35 which seems like a lot but with Tāmure at $20-$30 per kg at the supermarket they could have made more than one million dollars selling it direct to consumers. Of the total revenue from the two years of survey approximately 73% ($93,634.47) was absorbed in operation costs of the research vessel to process the catch. The remaining balance ($34,814.88) was returned to the Ministry of Primary Industry. That means even selling the dead fish dirt cheap the surveys make a profit for the Government. The self issued scientific permit to trawl in restricted areas is more profitable than some whaling trips the Japanese government justifies as science.

What else did they haul up?

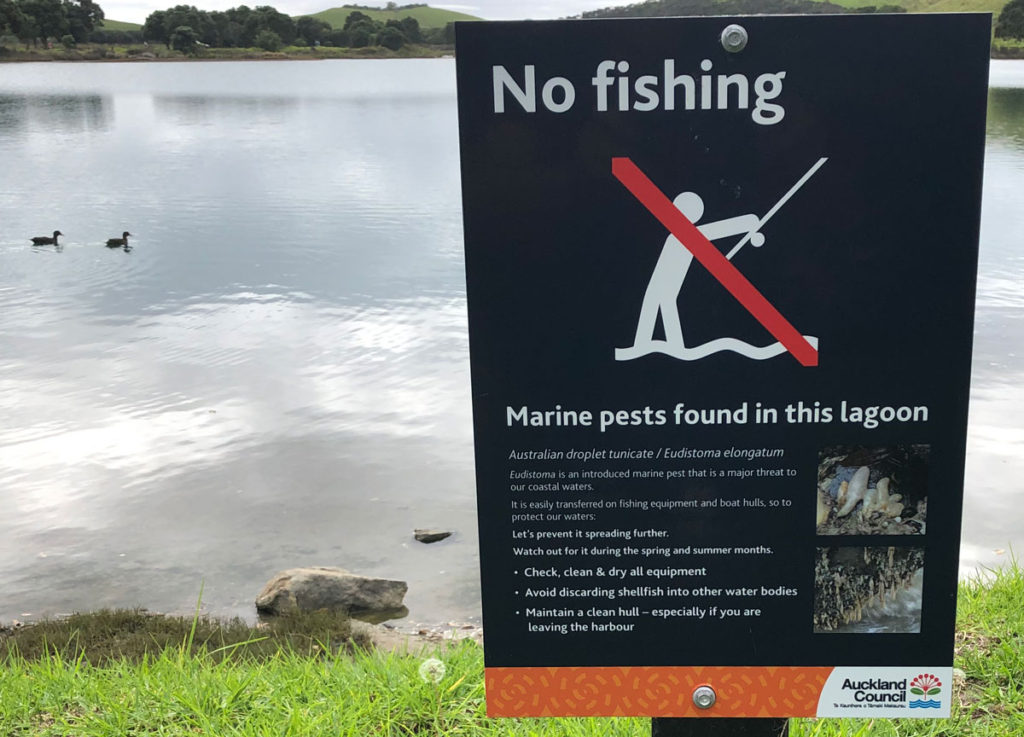
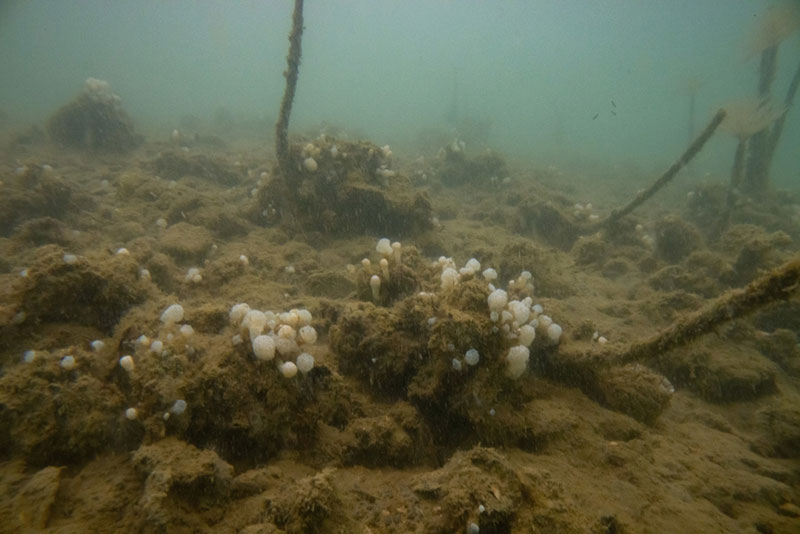
I was surprised to see invasive species like Mediterranean fanworm (Sabella spallanzanii) turning up in the catch. They are very skinny and should fly through the nets. There must have been very dense beds in places. It was disappointing to hear from my Official Information Act request that Biosecurity New Zealand was not informed of which stations had high numbers of the Unwanted Organism. The lack of interagency communication (even with MPI) sucks but the double standard is worse. When restoring the seafloor from fishing damage the Mussel Reef Restoration Trust must notify an MPI technical officer if it accidentally releases an Unwanted Organism (a legal requirement of moving Unwanted Organisms under the Biosecurity Act 1993). Bottom trawlers however can move them around the Gulf with no regard to Biosecurity. This shows how Biosecurity NZ favours industry over community groups.

Will they do it again?

The surveys continue despite FNZ no longer having a public license to bottom trawl the HGMP. There is 84% public opposition to fishing methods that impact the seafloor (Hauraki Gulf Forum 2021). Most fisheries scientists take samples 100’s of times smaller or use baited underwater video cameras to count and measure fish. FNZ definitely don’t have a social license to trawl in restricted areas but they are ploughing on. Because I make a living doing science communication its not in my interests to criticise the research survey but I had to because I think what they are doing is wrong.

Notes

I included trawl stations in areas where Danish seining is allowed and trawling is restricted in the restricted totals. The three stations had an average catch weight that lowered the average restricted catch weight and increased the average catch depth.

References

Sea Change 2017. Sea Change – Tai Timu Tai Pari Marine Spatial Plan. Hauraki Gulf Forum, Ministry for Primary Industries, Department of Conservation, Waikato Regional Council, Auckland Council. 2017.

MacDiarmid 2012. Assessment of anthropogenic threats to New Zealand marine habitats. A. MacDiarmid. New Zealand Aquatic Environment and Biodiversity Report No. 93 2012

NZFAR 2021. New Zealand Fisheries Assessment Report 2021/08. Trawl surveys of the Hauraki Gulf and Bay of Plenty in 2019 and 2020 to estimate the abundance of juvenile snapper. 2021. https://fs.fish.govt.nz/Doc/24856/FAR-2021-08-Hauraki-Gulf-2019-Bay-Of-Plenty-2020-Trawl-Surveys-4125.pdf.ashx

Hauraki Gulf Forum 2021. Results of Hauraki Gulf Poll by Alex Rogers. The Gulf Journal

https://gulfjournal.org.nz/2021/11/results-of-hauraki-gulf-poll/ Accessed December 2021

NIWA 2019. NIWA to survey young snapper in Hauraki Gulf. https://niwa.co.nz/news/niwa-to-survey-young-snapper-in-hauraki-gulf Accessed December 2021.

Feeding our forests

I have begun doing some work with the Northern New Zealand Seabird Trust who invited me to come and help them with some field work on the Poor Knights Islands. My father had visited the Islands when he worked for DOC in the 1990’s, his stories about the reptile abundance really inspired me to do restoration work, and I jumped at the opportunity to go.

Landing on the Island is notoriously difficult and our first shot at it was delayed, we had to go back to Auckland to wait for better weather. The islands are surrounded by steep cliffs that made European habitation impractical, Māori left the area in the 1820’s. This means the island I visited has never had introduced mammals, not even kiore! I spent days cleaning my gear to get through the biosecurity requirements which are incredibly strict for good reason.

I have explored a few predator free islands including Hauturu / Little Barrier Island which has been described as New Zealand’s most intact ecosystem. However it was only cleared of rats in 2004. When I am photographing invertebrates at night in mainland sanctuaries or forests with predator control (like Tāwharanui Regional Park or parts of the Waitakere Ranges) I see one reptile every eight hours or so. On Hauturu / Little Barrier Island I see them every 20 minutes, but on the Poor Knights it was every two minutes! Bushbird numbers were lower than other islands, I expect this is because reptiles and birds compete over prey species. I wonder if reptile numbers on other islands might be slower to recover because they are preyed on by bushbirds. I reckon that the Poor Knights total reptile and bushbird biomass is much greater than the restored islands I have visited. One reason for this is that reptiles use less energy to hunt than bushbirds but the other reason might be because it has more seabirds.

While walking through the bush at night I would sometimes hear a crashing in the canopy followed by a soft thump on the ground. In an incredible navigational feat the seabirds somehow land only meters from their burrows. At night I heard Buller’s shearwater, grey-faced petrel, little penguins and diving petrel (fairy prion finish breeding in February). While monitoring birds at night I was showered with dirt by a Buller’s shearwater who was digging out a burrow. In my short time on the island I saw cave weta and three species of reptile using the burrows. Like a rock forest the burrows add another layer of habitat to the ecosystem. It was incredibly touching to see the care and compassion the researchers had for some of the chicks who were starving while waiting for their parents who often have to travel hundreds of kilometres to find enough food. The chicks who don’t make it die in their burrows and are eaten by many invertebrates, the invertebrates in turn become reptile or bushbird food. The soil on the island looked thick and rich, when it rains nutrients are bought down into the small but famous marine reserve which is teaming with life.

I was only on the island for three nights but I was very fortunate to experience a pristine ridge to reef ecosystem. Seabirds are incredible ecosystem engineers who were an integral part of New Zealand’s inland forests for millions of years. Communities are making small efforts to bring seabirds back to predator free island and mainland sites with no control over seabird food sources. If we really want intact ecosystems we will have to make sure our oceans have enough food for seabirds to feed our forests.

What’s at the bottom of Jones Bay Lagoon?

I have driven past Jones Bay Lagoon many times and always wondered what’s down there. It was dredged for shingle from about 1870-1950 and would have had a stony seafloor like Jones Bay. I had heard that the mining might have made the lagoon 20 meters deep. Altho I knew there was sediment around the edges I imagined it was quite stable as most of the receiving catchment has been reforested including the regions best example of a wetland (albeit a small one).

Areas explored in green

I made a few transects at high tide. There was no noticeable current and the visibility above 4m was about 3m. However nearing the 5m mark the visibility dropped to .2m and was not much fun. I was able to easily plunge my hand into the seafloor about 30cm deep before it got uncomfortably sticky and heavy, the mud was very dark grey. The deepest spot I found was 7.5m with most of the lagoon at 5m. The contour of the seafloor varied and did not make sense with the odd ridge appearing in unexpected places.

I saw several fish including, a school of spotty, many yellow-eyed mullet in the shallows, a few snapper, and what I think were estuarine triplefin.

No Fishing. Marine pests found in this lagoon.

The biggest surprise however was the no fishing signs erected by Auckland Council. I was pleased to see them as it has always felt wrong to allow killing of native species in the Regional Park, which is supposed to be a safe place for nature. It was also a surprise given my recent request for Council to start managing the effects of fishing. This sign however is only here to manage a marine pest called Eudistoma or the Australian droplet tunicate.

Eudistoma are the little white things, the stalks belong to Mediterranean fanworm.

I knew that Eudistoma had reached the park because I was alerted by a member of the public on the 4th of February. It was no surprise as they were spreading fast and I documented dense areas of them on the other side of Kawau Bay in February 2019. The lagoon also had large numbers of Mediterranean fanworm (another marine pest) which interestingly often hosted native pleated sea squirts which I have not noticed on fanworm elsewhere. Mediterranean fanworm and Eudistoma are both present in the ocean, meters from the mouth of the lagoon. There was one small cockle bed in a sandy area and several areas with pacific oysters in the shallows. I have asked Auckland Council to comment on the closure which happened in spring 2020.

The Coastal Marine Area boundary on Unitary Plan viewer

Response from Auckland Council below.

The coastal marine boundary follows the South Coast/Jones Bay foreshore of Tāwharanui Regional Park, thus the lagoon is within the regional park, or at very least the land around it.

Fishing here is inconsistent with the general Regional Parks Management Plan to not take flora and fauna. The unwanted organism would be a threat to the Tāwharanui Marine Reserve. The regional parkland provides land based access to the periphery of the reserve and there is a real risk of transfer of organism in viable state on wet fishing gear between the two sites. The identification of the tunicate prompted a management response.

A short photogrammetric transect (4-5m)
Another slightly longer one, the fanworm are not as clear as I had hoped, I need to get much better at over-laping the frames.

I am making sure to decontaminate my dive gear, and I do not recommend the area for diving, in fact I think it might be with looking at the sediment inputs and, if they are low, considering the site for mussel bed restoration.

Indigenous biodiversity

I have 1,612 verified observations on iNaturalist between Auckland and Whangarei documenting 552 species (mostly invertebrates) covering forest, freshwater, intertidal and marine habitats. I don’t take many photographs of plants. Of these observation 96 or 17% of species were introduced. Here is a break down showing areas where I have found more or less introduced species:

Hauturu Aotea Tawharanui East Auckland Waitakeres Hunua Ranges Rangitoto / Motutapu / Motuihe Motukorea Mungatapere
Observations 206 149 141 197 77 94 71 33 159
Species 86 84 86 120 57 64 52 25 83
Introduced 6 12 8 35 1 4 11 4 9
Percent introduced 7 14 9 29 2 6 21 16 11

I expected the restored and protected islands in the Hauraki Gulf to have a smaller percent of introduced species. I think the high number of introduced species (compared to the Waitakeres and the Hunua Ranges) reflects the islands farmed history with islands like Motukorea and Motutapu still dominated by kikuyu. The larger and older the forest the more indigenous biodiversity.

Tracking footprints

I teamed up with computer and environmental scientist Jordi Tablada to build a website for identifying New Zealand animal sign. I met Jordi through the New Zealand Dotterel Forum as he looks after dotterel at Piha. We had overlapping skills and were looking for a project to collaborate on. He came to me with the idea inspired by some materials produced by another dotterel minder Emily Roberts.

Now when I spot tracks in the sand and wonder what made them I load up the website and check them against the examples. It’s working really well and I hope to expand it to include other animal sign and more species. Others are using it too, mostly due to some great press. It was inspiring to see another citizen science identification guide go live this morning which will also help on beaches. This one is for shells.

These guides join others produced by organisations like nzbirdsonline.org.nz and help users of tools like eBird and iNaturalist.nz map the diversity and abundance of New Zealand flora and fauna.

Hauturu kiwi monitoring trip

Cave weta, Pachyrhamma

I was recently lucky enough to monitor kiwi on Hauturu with the Little Barrier Island Supporters Trust. I have done this many times before at Tāwharanui with TOSSI. The exercise involves a good hike to the destination at night then sitting quietly in the dark listening to the sounds of the forest for a couple of hours. I have met some great people doing this and this trip was no exception. They patiently waited for me as I inched along the tracks on the way back to the hut, inspecting every tree for hidden treasures and some even came out with me again on their free nights. I have posted all my invertebrate observations here on iNaturalist where the community is helping me identify them all. I have also posted some fungi which were a hot topic among the volunteers.

It’s an incredible island where one can get a sense for pre-human New Zealand. Here is a list of some observations I made over the 12 days I was there.

  • I saw less invertebrates, birds and geckos at elevation.
  • Piwakawaka following Tieke on two occasions.
  • By weight there was much more industrial plastic pollution (mussel floats) than domestic plastic pollution on the beaches.
  • Similar gecko numbers in winter compared to summer. One seen every 20 minutes on night walks.
  • Cave Weta were the dominant weta by a factor of 10 or more. Tree Weta, Ground weta and Wētāpunga active.
  • Winter invertebrate abundance similar to mainland sites with predator control (and less birds). At night, in two out of three tress invertebrates were easily found.
  • Invertebrates not much bigger than raindrops stay hidden during the rain.
  • NZ Giant Centipede found 3m above ground inside a Kanuka tree that fell in the middle of the day. The species is very arboreal.
  • Korimoko chasing Ruru during the day.
  • Flock of 18 Kereru feeding on Muehlenbeckia.
  • A high of 12 Shore Skinks seen from one observation point. No other skinks observed.
  • Invertebrate diversity high with many species I had not seen before. Some had not been previously photographed in the wild.
  • Strange absence of Katydid calls.
  • Very empty streams with only Shortfinned Eel and Banded Kokopu observed. Huge flushing events the likely cause of low freshwater diversity and abundance.

Pest monitoring Selwyn Bush 2019

We identified 19 tracking locations (S1-S19) in 2014. The first 10 (S1-S10) were used in this survey. The survey was repeated in March 2019. The first 10 locations were searched and three out of 10 tracking tunnels were found. Seven new tracking tunnels were installed on the 10th of March. On the 16th of March another 9 tunnels were installed and all the tunnels were filled with an inked tracking card with peanut butter in the middle. Some locations were adjusted to make access easier. I noticed when trying to find the tunnels again with the Garmin InReach and App that the positions were often off by up to 16M. Thats a lot in the bush!

Locations of the 2014 tracking locations compared to the actual locations of the tunnels placed in 2019.

RESULTS

I find these mashed up prints very hard to identify, but here is my best guess:

S1 Hedgehog
S2 WW, Rat, Hedgehog
S3 Rat, Hedgehog
S4 Hedgehog, WW
S5 –
S6 –
S7 Hedgehog
S8 –
S9 –
S10 –
S11 –
S12 –
S13 –
S14 –
S15 –
S16 –
S17 –
S18 –
S19 –

WW = Winged weta, I was particularly looking for this species. See my blog post on tracking winged weta here.

Suspected winged weta tarsal pad print

I think we should probably ignore the tracking tunnels put out recently (S11-S19) as they may have been avoided due to (at at least some of) the target species being neophobic.

This would give us a result for 2019 of 20% Rat, 0% Mice, 50% Hedgehog. This indicates we have less rats & mice and more hedgehogs than 2019.

I have left the tunnels out there, it might be a good idea to retry in a few weeks. It’s interesting that we see more pests near the top of the bush, this has been observed before.

KMZ file with locations

Tracking winged weta

I first noticed ‘winged weta’ in 2016 when I took this photo of a pterapotrechus moulting. They are particularly abundant in Selwyn Bush, Kohimarama where community groups are doing pest management and restoration. I wondered how many times introduced winged weta were being mis-recorded in tracking tunnels as our native weta. No foot prints have been recorded to compare so my son and I collected six (males and females, small range in sizes) in less than five minutes. We dropped them onto a board with footprint tracking ink, photo above.

Here are some closeups of the hind leg footprints.

The footprints look very distinctive to me so we probably don’t have to try and understand walking pattern (see ‘Footprint Identification of Weta and Other Insects‘). I think this must be because the tarsal pads are paired for winged weta and not in native weta. This will make identification of winged weta quite easy going forward.