One of the interesting challenges associated with kūtai / mussel reef restoration in the Hauraki Gulf Marine Park (HGMP) is the lack of a reference bed.
The last natural soft sediment kūtai bed left in the HGMP is in an estuary and recovering after being wiped out by a storm in 2015. This means our best reference beds are those under or adjacent to kūtai farms or previously restored. Myself and other divers have helped look for a natural bed in The Noises group of islands which still has old kūtai growing on rocks. On the first of April (to celebrate the tipa / scallop closure which will temporarily protect the seafloor around the Noises from dredging for the first time ever!) I went for a dive / snorkel with Sue Neureuter who wanted to show me kūtai recruiting on shell near the base of some rocks. It was disappointing to see large losses the kūtai growing on the rocks due to a devastating combination of recreational harvest and this summers cyclone impact. The kina barrens were shocking and the area dearly needs protection. However we did find some recruits. The juveniles look very cosey in the old shell showing how dead shell still provides many ecosystem benefits, possibly including a suitable recruitment substrate. There is not much primary recruitment substrate around (kelp) but I did see some beautiful christmas tree hydroids.
Juvenile kūtai growing in adult shell
I was most excited to find a small c4mx4m bed of kūtai growing on soft sediment. I lifted kūtai up at the edge of the bed and they were only attached to each other and some dead shell. I don’t know if the kūtai recruited on to the shell hash here or if they came off the rocks and built up over several years. Some of the kūtai were old and large but most were closer to 9cm long. I did not measure any. I took some photos and spent two minutes doing some photogrammetry on part of the bed using this process I also took a sample of the shell hash.
The bed was remarkable because:
the kūtai sat at a very similar depth in the shell hash compared to softer sediments
the bed was lacking any signs of bio deposits from the kūtai (I have seen this once before at Marsden Point but thought it was just due to really high current which there is not here)
the bed had less colonial epifauna than restored beds
the bed showed no signs of clumping which is a very important feature of established beds
the bed had some young ecklonia radiata growing in it (I should have lifted one up to see what it was attached to)
the portion of the bed I mapped contains some >10 cooks turban suggesting shell is or was swept into the area
Let me know if you notice anything else unusual. If the Noises kūtai were protected and able to regenerate it would help us learn a lot about kūtai restoration.
I do wide angle macro photography underwater which helps me take great photos in yuck conditions. However it’s not so good for bigger fish who tend to not get that close. I tried 3D printing a little decoy for the end of my camera to see if it changed fish behaviour.
3D printed fish decoy that uses the laowa probe lens as an eye
I have only used it once but so far:
Bigeye (which the decoy design was based on, were not even a little interested).
Triplefins are not longer swimming under my lens (thats useful) but might be a bit more timid.
Red moki seem really curious, I’m sure they are doing a ‘double take’.
I’ll adjust my decoy a bit and do some more tests.
Movement of larvae has been modelled in the Hauraki Gulf / Tīkapa Moana / Te Moananui-ā-Toi. It’s beautiful to watch and I wish I could share it with you. No matter where the larvae start off they pulse north south with tidal rhythms that make it look like the Gulf is breathing. Depending on the swell, wind direction and currents they drift for 10’s of kilometres in all directions connecting east, west, north and south.
In this video I have tried to visualise what I saw and felt looking at the modelling work. I have used our six tiny marine reserves because they make a disproportionate contribution to breathing life in to the Gulf.
On an ordinary part of our coastline in 1975 our first marine reserve was created. The Cape Rodney-Okakari Point Marine Reserve at Leigh was difficult taking 13 years to overcome all the objections from fishers. 47 years on what have we learnt?
We now know the sacrifices those fishers made has been paid back a hundred fold. The reserve is home to large fish which make a disproportionate contribution to the Gulf Tāmure / Snapper population. It takes thirty six 30cm Tāmure / Snapper to make the same amount of eggs as one 70cm Tāmure / Snapper. Adult Tāmure / Snapper within the reserve at Leigh were estimated to contribute 10.6% of newly settled juveniles to the surrounding 400km2 area, with no decreasing trend up to 40km away. The commercial value of the nursey has been estimated at $1,490,000 per annum. That’s a huge contribution and it makes you wonder how bad things would be without the reserve, what’s worse we might not even know how bad it had gotten.
The marine reserve at Leigh was designed to act as a benchmark, a view of what an unimpacted ecosystem would look like. It’s the best place to experience marine wildlife. The fish are big and abundant, the water is alive and exciting. Putting your head underwater is like looking back in time when the ocean was healthier.
With every passing generation we lose memories of abundance and diversity. When I wonder if I saw more seahorses as a child I can’t be sure. This is the value of having a reference point to measure marine health.
Our marine scientists now understand edge effects, population source & sink dynamics and the connections between geology, habitat and biodiversity. They understand how intact ecosystems are more resilient to pollution and change. At 2,350ha the new Waiheke marine reserve is four times the size of the Leigh marine reserve (547ha). I think it will out perform the Leigh marine reserve and deliver our best chance of experiencing an intact marine ecosystem in the inner Gulf. It could be a benchmark, the gold standard to which we measure other changes we make.
There will be many additional benefits for the Waiheke marine ecosystem like protecting against overfishing and improving the resilience in the face of climate change and pollution. But it’s the reserves function as an experience of unimpacted ecosystem, a window back in time, not just to 1975 but further back before human impact, that’s what we hope to discover.
But this time machine won’t happen without your support. Please visit https://www.doc.govt.nz/waihekeproposal/ and let the decision makers know what excites you about the proposal.
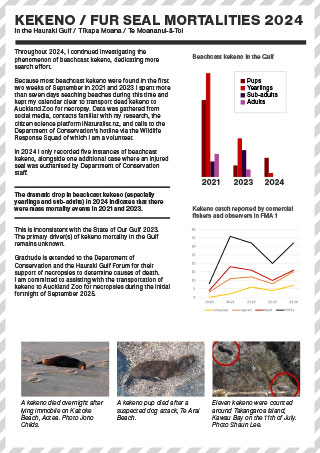
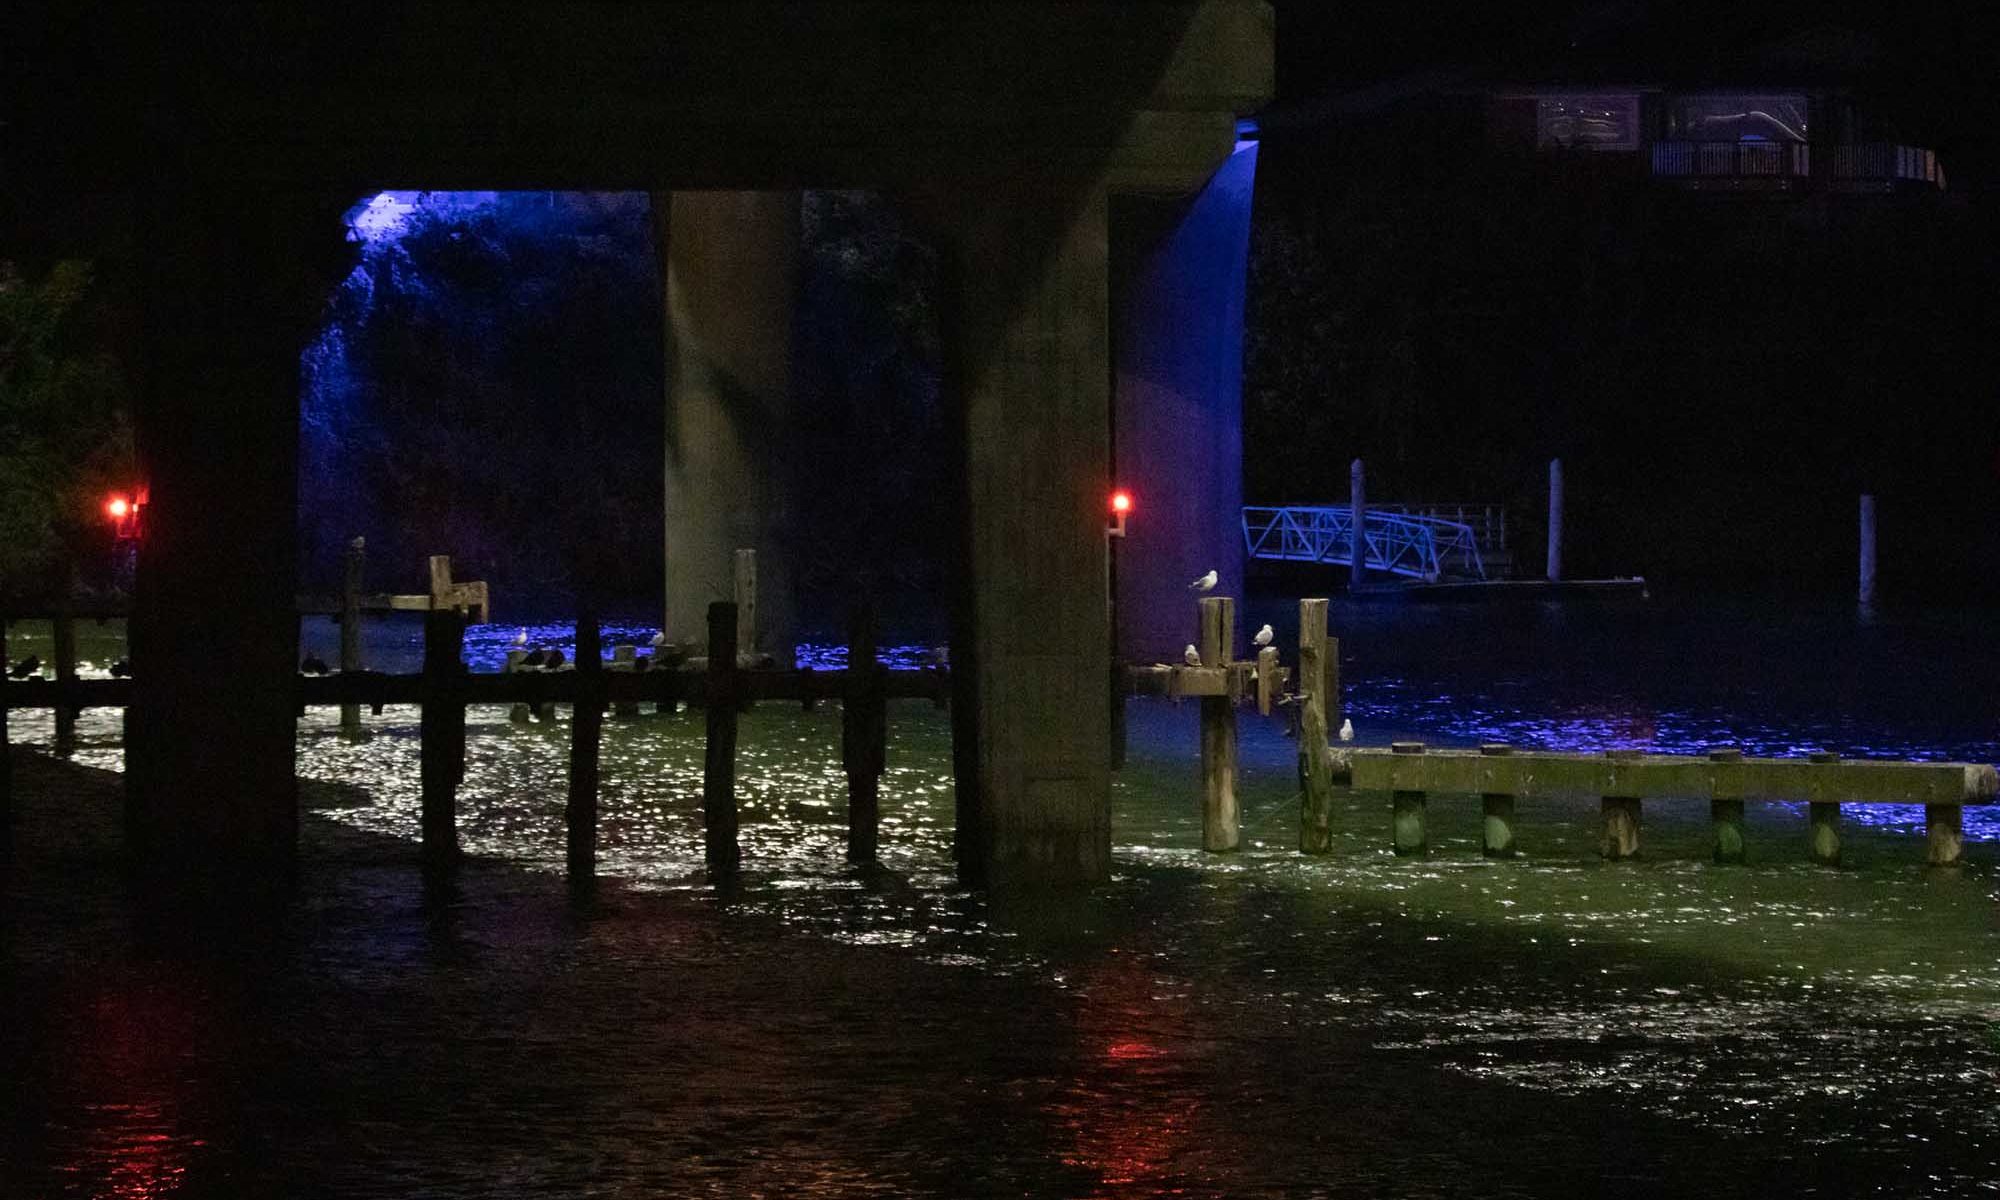
My unrequested report to Auckland Transport (AT) following the completion of a new bridge (part of the AMETI / Auckland Manukau Eastern Transport Initiative) above a colony of native Tarāpunga / Red-billed gulls.
In response AT commissioned this report from BECA. It has a few errors (southern black-backed gull dont nest in the area but white-fronted tern do) but I mostly agree with it. They missed opportunities to point out that more research should be done on light impacts and the possibilities for shielding.
There have been decades of korero about marine protection in the Hauraki Gulf / Tīkapa Moana / Te Moananui-ā-Toi. Everyone knows we urgently need more protection but the Governments proposals are too small, experimental, slow and ignore Waiheke Island.
The only concern I have about the Hākaimangō – Matiatia Marine Reserve (Northwest Waiheke Island) application is the lack of published support from iwi authorities. My understanding is that the applicants and the Department of Conservation continue to engage iwi (nine months to date), but while iwi authorities at this stage have not committed their support they are interested in dialogue and importantly they have not opposed the application. Two leading descendants of 19th century Waiheke Ngāti Paoa chiefs, Moana Clarke and Denny Thompson have expressed open support. Iwi politics in the Treaty settlement era are complex and difficult for me as a pakeha to understand. I am concerned about the considerable expectations put on Māori. If we limit our support to co-designed or iwi led marine reserve applications we would be burdening iwi with a responsibility for marine heath they do not seem to be resourced to implement. There are no published concerns about the proposal from iwi. 77% of Māori support 30% marine protection in the Gulf (Hauraki Gulf Forum Poll 2021). I hope that the iwi leaders will put the mauri / lifeforce of the HGMP first and support the application. In the meantime the cautious approach of iwi authorities is no reason not to support the application. If any iwi do have concerns we should take great care to hear and work through those concerns, they have significant rights as mana moana.
UPDATE 28 February. A local iwi body the Ngāti Paoa Trust Board are supporting the application.
1. We don’t have enough protection. A tiny 0.33% of the Hauraki Gulf Marine Park (HGMP) is fully protected from fishing, the governments Revitalising the Gulf plan will hopefully increase this area to 0.575% by late 2024 (Revitalising the Gulf 2021). The other forms of protection suggested in the plan all involve some kind of fishing. We need places where with intact ecosystems where our taonga and heritage don’t get eaten. The proposed Hākaimangō – Matiatia Marine Reserve is a significant addition at 0.195% of the HGMP. All the proposed protections need to be actioned as soon as possible to reverse the decline of biodiversity and abundance in the HGMP (State of our Gulf 2020). If all the proposals are accepted only 6.7% of the HGMP will be protected from fishing (excluding cable zones which are not designed to protect biodiversity). We will need many more proposals to meet the Hauraki Gulf Forums goal of 30% protected.
2. It’s long term. Rāhui enacted through section 186 of the Fisheries Act only last for two years. This is not the right tool to use to sustain large breeding animals live for more than 50years. Tāmure / Snapper can live to at least 60 years of age (Parsons et. al. 2014).
3. It’s big. For decades scientists have been telling us that our marine reserves are not big enough to protect wildlife from the edge effect. If approved at 2,350 ha Hākaimangō – Matiatia would be the largest marine reserve in the HGMP.
4. It’s in a great spot. The site covers an ecological transition zone between the waters of the inner and outer Gulf. The inner Gulf is slightly cooler, more turbid, shallower, low energy (sheltered by a screen of islands including Waiheke Island) compared to the outer Gulf which is deeper, warmer, clearer and comparatively high energy marine environment. The site was select by marine biologist Dr Tim Haggitt after doing extensive surveys around Waiheke Island in 2015. The area is geologically remarkable for its extensive underwater platforms and terraces, the diversity in physical habitat is reflected in the flora and fauna.
5. There are plants and animals left worth protecting. Functionally extinct species like Kōura / Crayfish (Jasus edwardsii & Jasus verreauxi) are still found in the area so the recovery time here will be faster than other overfished areas of the HGMP.
6. We need more baby fish. It takes thirty six 30cm Tāmure / Snapper to make the same amount of eggs as one 70cm fish (Willis et. al., 2003). This marine reserve would dramatically increase egg production in the HGMP. Marine reserves make a disproportionate (2,330% Tāmure / Snapper in the reserve at Leigh) larvae spillover. Adult Tāmure / Snapper within the reserve at Leigh were estimated to contribute 10.6% of newly settled juveniles to the surrounding 400km2 area, with no decreasing trend up to 40km away (State of our Gulf 2020).
A 40km radius from the centre of the proposed marine reserve.
7. Fishing on the boundary will be awesome. The proposed marine reserve is big enough for people to fish the borders with a clear conscience. Fishing here will be popular with many big fish leaving the area (See Halpern et. al. 2009 on spillover).
8. People want marine reserves. Marine reserve support is strong and getting stronger. On island support for marine protected areas from island residents was 67% with off-island ratepayers at 54% in 2015. A 2021 poll by the Hauraki Gulf Forum shows general support for 30% protection at 77% with only 5% opposition. The poll showed no difference in support from Māori.
9. It’s a great cultural fit. Most people who live on Waiheke Island really care about the environment. Conservation values are strong across the different local communities.
10. It will be great for education. The marine reserve will create much richer outdoor education opportunities for the young and old people of Waiheke and Auckland. Rangitahi in particular will benefit from being able to experience an intact marine ecosystem. Te Matuku Marine Reserve is less suitable for education because the water clarity is dramatically impacted by sediment.
Left: Diver at high tide in the Te Matuku Marine Reserve. Right: Wheke / Sydeny Octopus at high tide in the proposed marine reserve. Photos by Shaun Lee.
11. Resilience to climate change. By maximising biodiversity and abundance the marine reserve will protect the HGMP from climate change impacts, particularly heatwaves, invasive species and ocean acidification. Marine reserves are like insurance against uncertainty.
12. Improving the economy via commercial fisheries. Juvenile Tāmure / Snapper leaving the Cape Rodney to Okakari Point (Goat Island/Leigh) Marine Reserve boosted the commercial fishery by $NZ 1.49 million per annum (Qu et. al. 2021). Auckland University found 10.6% of juvenile snapper found throughout the Gulf – up to 55 km away were sourced from this one marine reserve. The researchers found economic benefits to the recreational fishery are even more substantial. There are other commercially fished species in the area. The proposed marine reserve is four times bigger than the Goat Island reserve.
13. A benchmark. No harm marine reserves provide a reference point for assessing the impacts of our activities elsewhere. “As kaitiaki in the broadest sense, we have an obligation to preserve natural examples of marine ecosystems” – State of our Gulf 2020. Data obtained from marine reserve monitoring compliments fisheries information and matauranga Māori to help us understand environmental change.
14. Science. Marine reserves are a natural laboratory. They have contributed massively to our understanding of marine ecology and ecological processes. Many of our leading marine scientist studied and conducted research in marine reserves at Leigh, Tāwharanui, Hahei and elsewhere. Of course the Marine Reserves Act expressly recognises the scientific importance of marine reserves. Scientific research is an over-riding priority in the Act,
15. Tourism benefits. The marine reserve will add to the growing ecotourism opportunities on Waiheke Island. It complements the $10.9 million dollar investment in Predator Free Waiheke (Predator Free 2050 Limited 2021) which has a vision to become the world’s largest predator-free urban island. The marine reserve will be much cheaper to create and maintain and will deliver a mountains to the sea nature experience.
16. Return on investment. The Cape Rodney to Okakari Point Marine Reserve (Goat Island) generated $18.6 million for the local economy in 2008 at a cost of about $70,000 for the Department of Conservation (State of our Gulf 2020).
The Hauraki Gulf / Tīkapa Moana / Te Moananui-ā-Toi can not afford to have this application sit on a shelf waiting for stronger political leaders. Please start the process of creating the Hākaimangō – Matiatia Marine Reserve and healing the wider area as soon as possible.
Parsons DM, Sim-Smith CJ, Cryer M, Francis MP, Hartill B, Jones EG, Port A Le, Lowe M, McKenzie J, Morrison M, Paul LJ, Radford C, Ross PM, Spong KT, Trnski T, Usmar N, Walsh C & Zeldis J. (2014). Snapper (Chrysophrys auratus): a review of life history and key vulnerabilities in New Zealand, New Zealand Journal of Marine and Freshwater Research, 48:2, 256-283, https://doi.org/10.1080/00288330.2014.892013
Qu et. al. (2021). Zoe Qu, Simon Thrush, Darren Parsons, Nicolas Lewis. Economic valuation of the snapper recruitment effect from a well-established temperate no-take marine reserve on adjacent fisheries. Marine Policy. Volume 134. https://doi.org/10.1016/j.marpol.2021.104792
Willis, T.J., Millar, R.B. and Babcock, R.C. (2003), Protection of exploited fish in temperate regions: high density and biomass of snapper Pagrus auratus (Sparidae) in northern New Zealand marine reserves. Journal of Applied Ecology, 40: 214-227. https://doi.org/10.1046/j.1365-2664.2003.00775.x
Halpern, B., Lester, S., & Kellner, J. (2009). Spillover from marine reserves and the replenishment of fished stocks. Environmental Conservation, 36(4), 268-276. https://doi.org/10.1017/S0376892910000032
Fisheries New Zealand (FNZ) is designing an NZ first Fisheries Management Plan for the Hauraki Gulf Marine Park that they are calling Ecosystem Based as part of the Revitalising the Gulf – Government Action on the Sea Change Plan. They are seeking an advisory group as part of their discourse of delay (Revitalising the Gulf was launched six months ago). I have not asked to be part of the process. Because the advisory group does not have any decision making capability it won’t be very effective in managing commercial fisheries (like Sea Change), this is because FNZ has been captured by industry (Parker 2016). FNZ also only want advice from people with experience in Fisheries Management, based on the state of Gulf this is like asking the Tabacco Industry to regulate smoking. But they might be able to reduce recreational catch which I think has the biggest impact on the Gulfs reef ecosystems. Unfortunately of the five voices, only one will be from the environmental sector, so it doesn’t have much of a chance of being ecosystem based, and to be truly ecosystem based; the scope would have to include the management of other impacts on the ocean like plastics and sediment (Government departments have hand picked recommendations from the Sea Change which was the only attempt at an integrated management plan). The plan will start to address the effects of fishing which FNZ should have been doing since the act was established in 1996. The Sustainable Seas Challenge has a project investigating what Ecosystem Based Fisheries Management would look like for the Gulf, it’s so political even the scientific proposal is two months late.
The outcomes of the proposed plan are:
Healthy, functioning aquatic environments that support sustainable fisheries
Fish stocks at levels which meet the needs of treaty partners and stakeholders
Inclusive and integrated regional participation in governance of fisheries
Like more than 10% of New Zealanders I don’t eat our native wildlife, my suggestion for creating a really Ecosystem Based Fisheries Management Plan would stop all fishing in the Gulf and not be very popular 😀 So here are some ideas that might be a bit more palatable. First of all my outcomes would be different:
Clearer water
Restored kelp forests (no kina barrens & carbon sequestration)
Increased biodiversity and intact ecosystems
Increased abundance
Climate change resilience
Obviously we need to stop bottom contact fishing (as per Sea Change and the Hauraki Gulf Forum goals) but on top of that, this is what I would do to achieve the above outcomes.
Provision 1: No more killing of functionally extinct native wildlife and habitats.
These species need to recover to much higher levels to perform ecosystem services and increase biodiversity. Species I consider functionally extinct. Kutai / Green-lipped mussels, Kōura / Spiny rock lobster and Packhorse rock lobster, Hapuku, Sharks etc.. Where populations of species are not known fishing should stop (precautionary approach) and the group complaining about the closure should pay for the science to measure it (user pays). Many species are in such a bad state we now need to also stop fishing practices that might kill them as bycatch (eg. Killing juvenile Hapuku who have a pelagic phase in Purse Sein nets). The sooner we stop killing the species the sooner we will see them recover. The advisory group will suggest long rebuild times for populations so they can keep killing as much as they can for as long as possible. I would stop all killing right now and wait until stocks have recovered to 80% biomass and there contribution to ecosystem function has been measured before considering harvesting again.
Provision 2: Reductions in the take of food for functionally extinct native wildlife.
This has been said before but just for marine mammals “Management of the Greater Hauraki Gulf should take into account the potential for trophic and system-level effects of re-establishment/recovery of marine mammals towards historical levels.” MacDiarmid 2016. I think it should apply to other functionally extinct predators like Hapuku.
Provision 3: No more killing native filter feeding animals that live on the seafloor.
Not everybody will love this idea but everyone will love the result – clearer water. The Gulf has been overloaded by sediment and nutrients and the tap is still running. Filter feeding animals help clear the water by removing sediment from water while looking for food (mostly phytoplankton).
Increasing populations of filter feeders that live on the seafloor, Kutai / Green-lipped mussel, Tipa / Scallop, Tuangi / Cockle, Hururoa / Horse mussel, Tio / Oyster etc will increase water clarity which will increase kelp biomass and carbon sequestration. Other benefits include more complex benthic habitats which are nurseries for fish, removal of harmful pathogens and even the production of sand. Increased water clarity benefits visual predators like Tāmure / Snapper and Human spearfishers.
In some parts of the Gulf a lot of money is being spent trying to actively restore shellfish, by not killing shellfish in areas where we still have remnant populations we can increase larval supply across the Gulf. Passive and active restoration activities are complementary.
Provision 4: Dramatic increases in forage fish populations.
By weight most of the fish in the Gulf are also filter feeders. These forage fish swim around in large schools with their mouths open feeding on zooplankton. Unlike the bivalves listed above they do not bind sediment up in balls and deposit it on the seafloor. This means not all the above benefits of increasing their populations apply, however its likely they play a critical role in the Gulfs ability to sequester carbon. I’m most interested in increasing forage fish populations because they are critical to many Gulf food webs. Commercial harvest of some forage fish like Blue mackerel has increased 300% in the last 20 years. This is reducing the amount of food available to protected species that we want more of, like whales and seabirds. Populations of most forage fish are not known so that would be the first step, I would then set the Total Allowable Catch (TAC) for Ecosystem Based Management (EBM) very low (E.g. 20% unfished biomass) and invest more in monitoring the breeding success of their predators (seabirds and cetaceans) and adjust the TAC accordingly.
Provision 5. Maximum size limits for recreational species.
Restoring Kōura / Spiny rock lobster and Packhorse rock lobster numbers is going to take a long time and they will need help to push back Kina / Sea urchin barrens and regrow our kelp forests. We can fix this by creating a maximum size limit for Tāmure / Snapper. Bigger snapper are better at managing Kina populations and are dramatically better at making baby Tāmure / Snapper. If the later is true for all finfish then it makes sense to introduce the maximum size limit across all species. Recreational fishers could still have fishing competitions but they would have to be catch-and-release. Large fish should learn to avoid hooks overtime reducing harm and selecting for traits that support catch-and-release. R&D would be required to match the gear to fish size for the longline fisheries but as I said earlier this group hasn’t been set up to have the power to influence commercial take.
Provision 6. Effort controls with gear limits.
We need to get much less good at killing fish. Methods like nets, pots and dredges need to be banned along with long lining. Gear restrictions should also apply to methods with high levels of bycatch. This is not just what is used (eg. set nets catching protected bird species) but also how (eg. Let’s stop all fishing in workups and spawning aggregations). This means a lot of re-educating fishers, the introduction of a license would be sensible (like Australia which has had licenses for 20 years and is not known for being progressive on wildlife protection).
Provision 7. A network of Marine Protected Areas covering at least 30% of the Gulf.
Source–sink dynamics are not hard for anyone interested in population management to understand. No-harm areas where populations can reach near 100% of their un-fished state can feed exploited areas. No one would design a conservation management plan on land without a wildlife refuge. I don’t see why the design of network of such areas should not be part of an ecosystem based population management plan in the ocean.
“It would be logical to close some scallop beds and create passive restoration (broodstock areas) to increase the fishery yield”
– Dr Mark Morrison, Shellfish Restoration Co-ordination Group, December 2021.
A recent poll showed that the 30% protection policy had 77% support from the public including Māori. These areas would serve as a reference point to compare the impacts of fishing elsewhere in the Gulf and provide the best possible resilience to climate change impacts like ocean acidification (which scares me more & more every time I look into it). One of the most difficult hurdles for Marine Reserve applications is the perpetual nature of the policy. Creating MPAs under a fisheries management plan would be a lot easier, voices of those seeking protection in the Gulf (like me) will go quiet the longer the areas stay closed to fishing and visa versa.
It’s a good time to share ideas on what an Ecosystem Based Fisheries Management plan would look like. There are some attempts to define it here, but they all try to avoid the idea of simply killing less native wildlife, no one wants to pay for that research.
References
MacDiarmid 2016. Taking Stock – the changes to New Zealand marine ecosystems since first human settlement: synthesis of major findings, and policy and management implications. New Zealand Aquatic Environment and Biodiversity Report No. 170 A.B. MacDiarmid et al. June 2016. Ministry for Primary Industries.
Parker 2016. Hon David Parker https://www.parliament.nz/en/pb/hansard-debates/ rhr/document/HansS_20160920_054787000/parker- david
UPDATE 6 MAY 2022
The Hauraki Gulf Fisheries Plan Advisory Group has been announced. The Chair is an old school fisheries scientist who is responsible for the current fish populations. There are three commercial voices and one (or one and a half) recreational. There are only two voices for serious change. I am not counting on it delivering significant change.
UPDATE 3 MAR 2023
My submission on the proposed plan which refines thoughts I began in this blog post. It includes additional critique of the draft plan and many new measures.
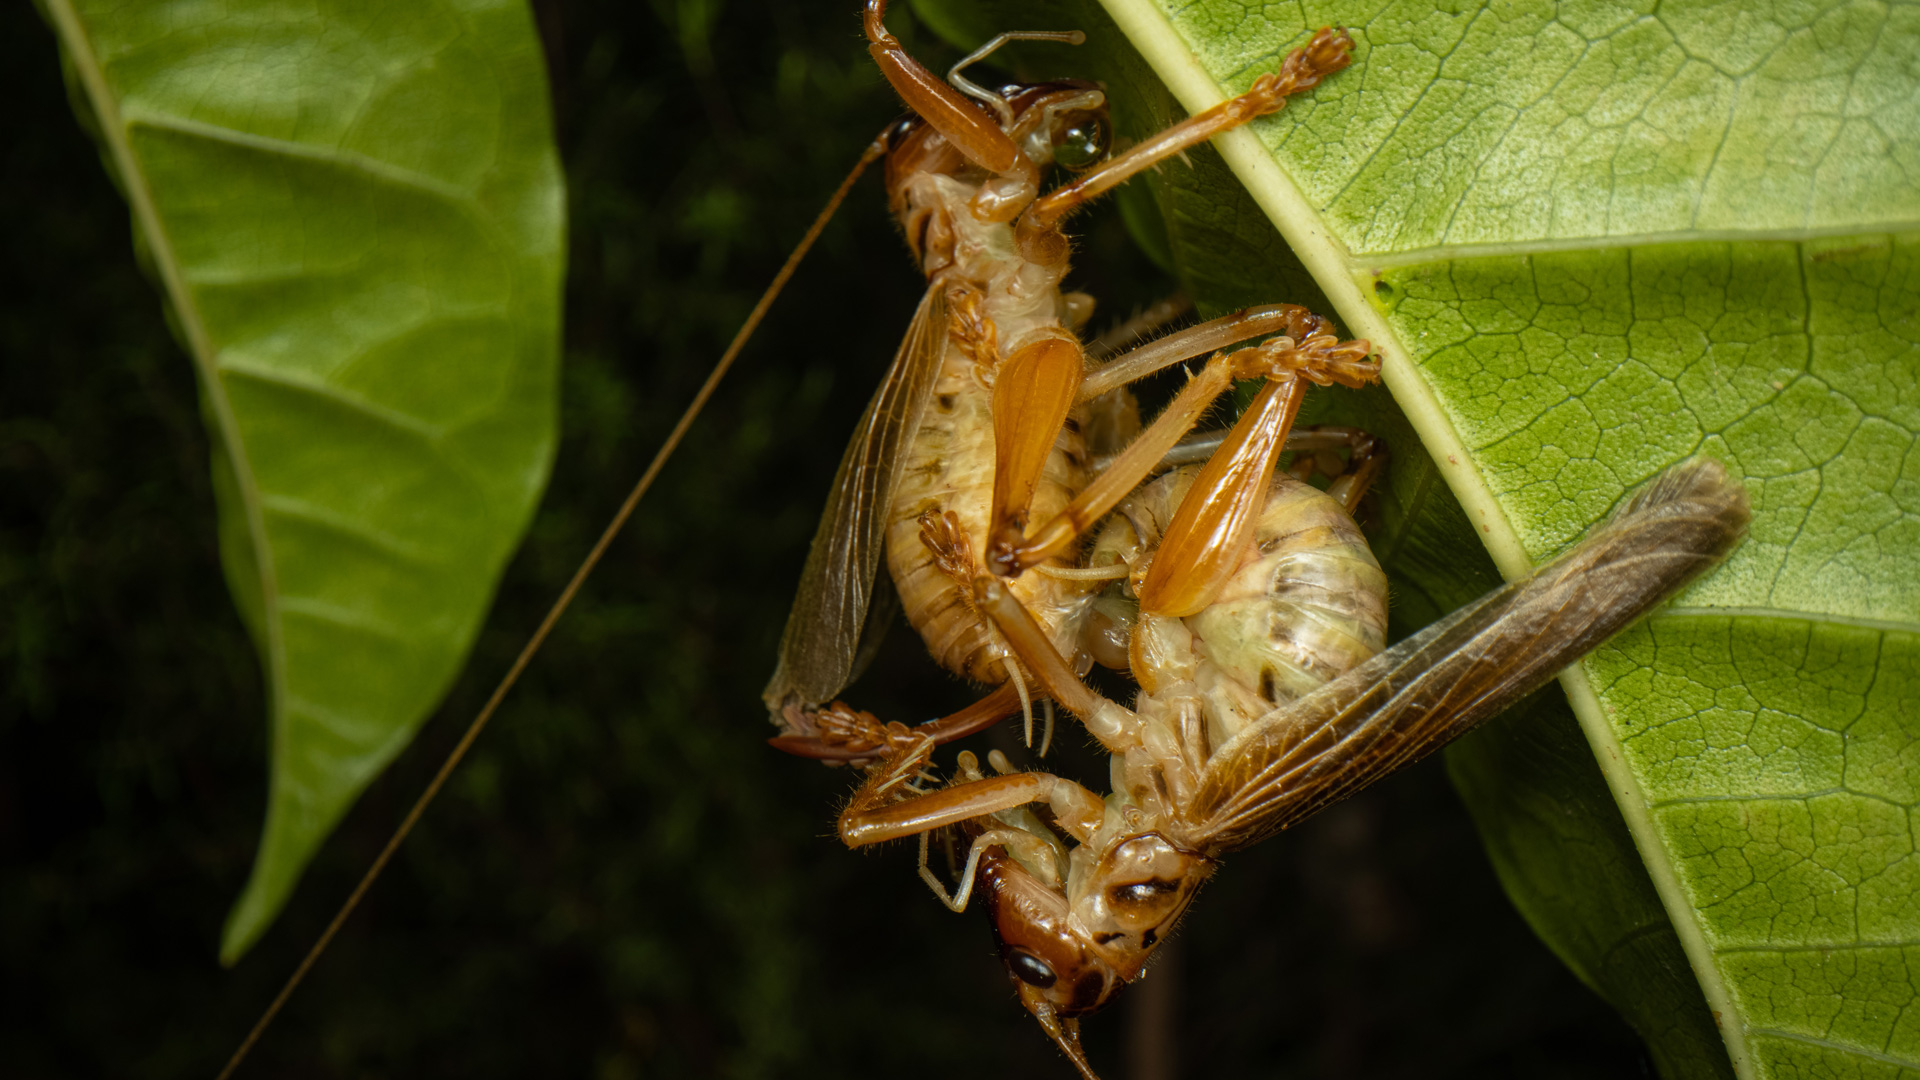
How to identify Australian Winged Wētā / (Pterapotrechus sp) which have been introduced to New Zealand.
Update February 2025: Orthopterist Danilo Hegg has identified the Australian Raspy Cricket to a species level, it’s called Pterapotrechus salomonoidesso


