I asked Maritime NZ for the oil spill trajectory modelling from the wreck of the RMS Niagara. I have uploaded it here for anyone interested.
My layman’s notes below:
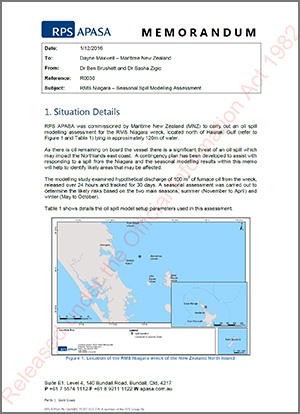
MNZ have kindly tried to explain it to me, but I don’t really understand why the 2016 modelling was only done with about 97 tonnes of oil (100 m³) when the Rena leaked 350 tonnes. The RMS Niagara could store more than 4,000 tonnes of oil and experts have estimated that there could be 1,400 tonnes remaining. This means the estimated volume of oil on individual beaches and the length of shoreline impacted could be dramatically worse.
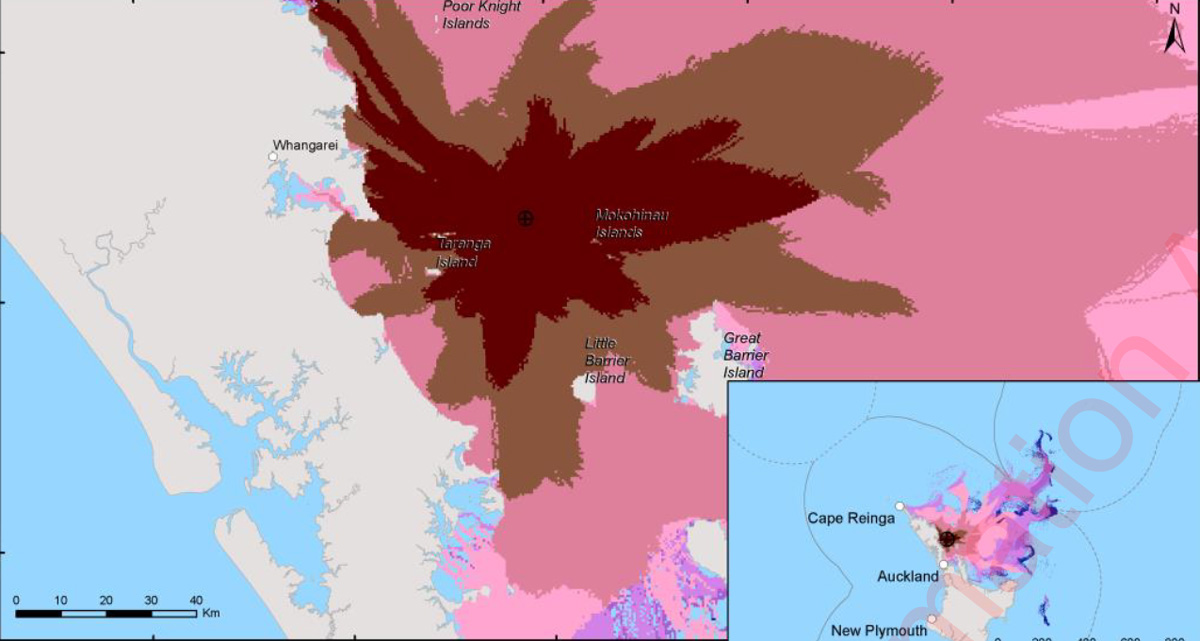
The probability of oil contact with the shoreline increases by 10% if it happens in summer (This is tara iti / New Zealand fairy tern breeding season, we are down to nine breeding female left, note the Rena spill killed 2,000 birds). The impacts move a bit further south in winter.
It’s interesting to see the areas impacted. The spill expands outward from the wreck largely as you would expect, but there are interesting details. For example, it will be twice as bad at Goat Island than further up the coast at Mangawhai. If it’s going to be visible at the Mokohinau Islands in just a few hours, I think it might be a good idea to install a webcam there.
Harbours and bays are less impacted, but I wonder if this is an artefact of the modelling software. It definitely shows that even a 97-tonne spill will span a massive length of our coastline. For example, Waikato Regional Council also needs to be prepared.
I’d like a better understanding of the risk and the mentioned contingency plan. It would be helpful to run scenarios with different response times, gear, and methods; this may have already been done.
UPDATE: 10 Dec 2024. I asked Maritime NZ for costings for Stage 2 of the survey of the RMS Niagara wreck. Summary: The estimated cost for Stage 2 of the RMS Niagara wreck survey totals NZ$13.74 million, split into two parts. Part 1 involves a visual survey using a remotely operated vehicle (NZ$1.3 million). Part 2, requiring a dynamic positioning vessel due to proximity to submarine cables, includes hull cleaning, oil level measurement, and risk assessment (NZ$12.44 million). A moored vessel alternative for Part 2 costs NZ$4.5 million but is not recommended due to the risk to undersea cables. An additional NZ$500,000 is estimated for oil pollution response readiness during the survey.