Brief for restoring extremely degraded seafloor ecosystems

Degraded seafloor - sediment - mudification

I don’t know how to solve this problem, so I am writing it up as a public brief for people smarter than me.

Brief for restoring extremely degraded seafloor ecosystems

Soft sediment marine ecosystems support diverse and productive biogenic habitats like shellfish beds, sponge gardens, tubeworm fields, and bryozoan mounds. Direct impacts such as mobile bottom contact fishing, and indirect impacts such as sediment pollution, reduce the function of these habitats. Stopping or reducing the impacting activities can help the habitats recover naturally over many decades. Active restoration (like mussel and oyster seeding) can be done in areas where the habitat is not recovering naturally; however, some environments can be too degraded for these methods.

Problem

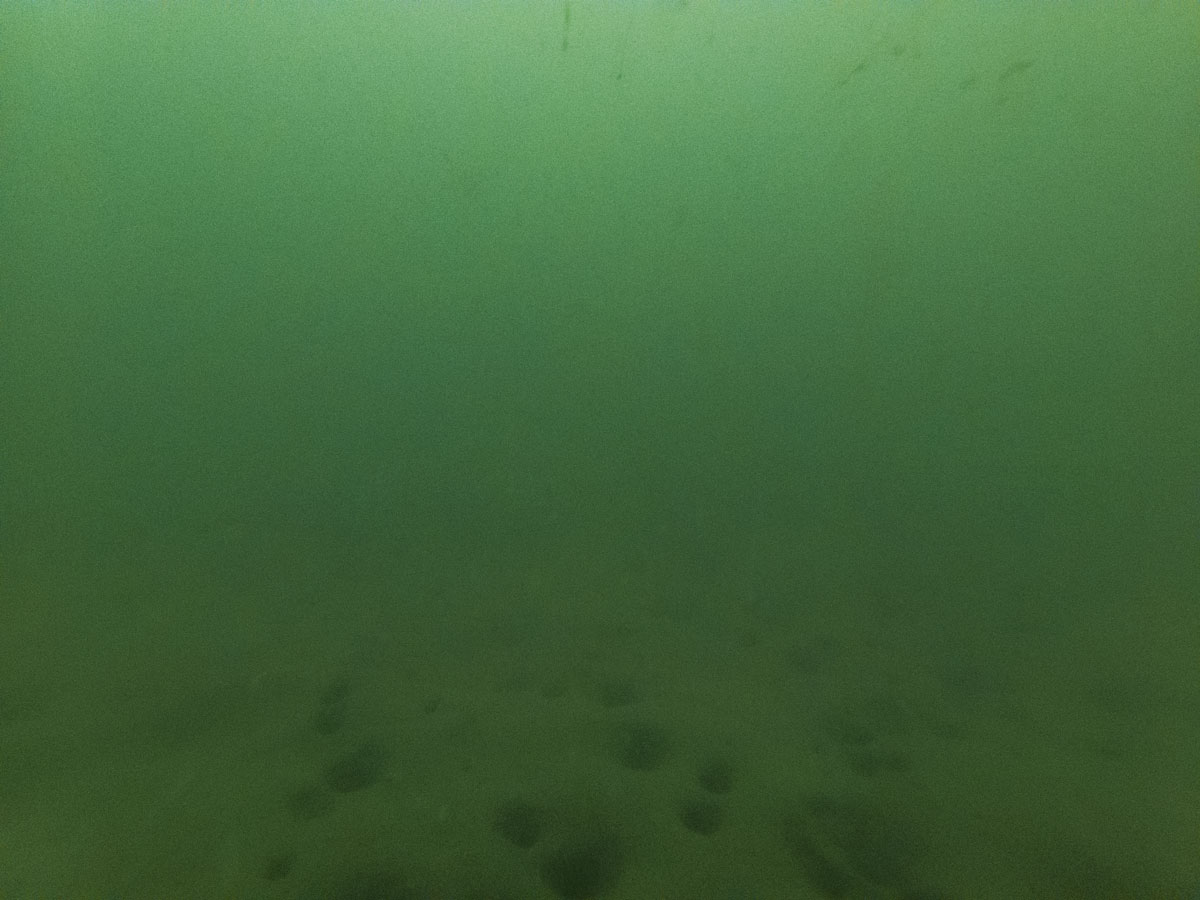
In my opinion, at least tens of square kilometres of the Hauraki Gulf Marine Park are too degraded to restore with known techniques. In these extremely degraded areas, the seafloor is very soft, deep mud. It’s not lifeless; there are burrows and infauna present. But the areas would be more diverse and productive if the seafloor was less soft with less sediment in suspension. Even when pollution input has been reduced in these extremely degraded areas, legacy sediment is constantly resuspended – choking filter-feeding animals and smothering photosynthesising plants. It is difficult to visually convey the condition of these ecosystems, as visibility is usually less than 30 cm on a good day.

Solutions

To increase biodiversity in these areas, the benthic enhancement method must be low-cost at scale. This means traditional erect concrete and steel structures are not likely to be the solution. In my opinion, resurfacing the seafloor with demolition rubble or quarried aggregate is too extreme because it kills all the infauna. Anything heavy deployed will immediately sink into the mud, anything lighter than the mud will quickly be covered by sediment. A smarter solution might contain one of these elements:

  • Local pits or trenches to collect the most mobile sediment.
  • Dispersed erect artificial shellfish (think horse mussels) to slow benthic currents and allow sediment to fall out of the water column in fields or fences.
  • Regular deployments of waterlogged woody debris.
  • Biological concrete structures that grow using elements from the local environment.
  • Hardened local seafloor sediments (think mudbrick or mudcrete).
  • Growing dense algae at the surface which will 1) slow currents and surge to reduce resuspension 2) drop fragments for sequestration, feeding invertebrates, collecting sediment and seafloor hardening.

Caution

While these solutions will restore some ecosystem function they will not restore the original ecosystems. Hard surfaces will likely be first colonised by invasive species and the new habitat will offer more ecosystem services but be novel / new. We must first halt the destructive activities that degraded the seafloor ecosystems.
New Zealand’s dairy industry

New Zealand dairy industry

Environmental reports and main stream media are often critical of different aspects of the New Zealand dairy industry. Here I summarise them together in one graphic. View at higher resolution by clicking on the image below.

Graphic summary of the New Zealand’s dairy industries impacts.

References – resources for further reading on the impacts of New Zealand’s dairy industry.

Digging up our streams

I took this photo last week of earthworks in a stream in 70 Estuary Drive, Mangawhai Heads. I contacted Kaipara District Council to see if it was compliant (Job number SR2304941). They phoned me to say the landowner had a consent for earthworks (it had been extended). Apparently the landowner had dug out the area as recent rain had turned it into a swamp which was a danger to children. I told the officer that another set of eyes may have called it a wetland, however as I did not have a pre-earthworks photo as evidence I could not take my complaint further.

Photo kickstarts stream restoration

I recently had a great experience with Waikato Regional Council (WRC) which showed the value of just letting council know whats happening.

I was driving past  270 Kuaotunu, Wharekaho in the Coromandel and saw cattle defecating in the stream. I was in a hurry but decided to take a quick photo and reported it a few days later. I got a great response from WRC. The land is owned by the crown, managed by Thames-Coromandel District Council (TCDC) and leased to a farmer. The stream is a priority one waterway given it’s proximity to the coastal marine area which cannot have stock access without a resource consent.

Staff discussed the issue and the farmer running cattle on the property will now remove cattle from the land. TCDC envisage releasing the tenure to the Department of Conservation who may review activities at the site and consider restoring it. What a great outcome! I am very impressed with all agencies involved.

August 2024

Erosion in Wai O Taiki Bay

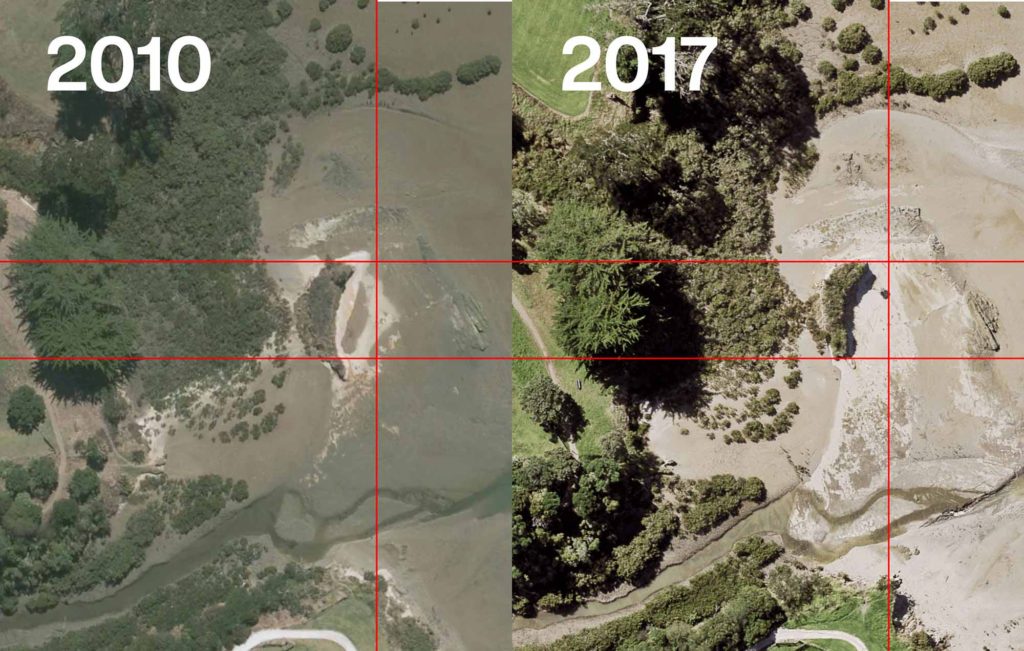
A 2016 Tonkin & Taylor report on the erosion of the banks of the Tamaki Estuary in Wai O Taki Bay suggested a 3-5 m/100 year range rate of retreat. I took some photos in 2013 so wanted to see if the prediction looked right for the last seven years.

The 2021 photo has more grass and that the failing fence is not keeping people off the closed track.
The 2021 photo has more exposed bedrock showing a loss of soil. The flax bush is now very exposed to elements and will likely die in the next few years. Soil loss is apparent adjacent to the unfinished seawall.
The 2021 photo shows how the harder substrate has changed its shape. Roosts of dead pine rotting and stumps falling down slope. Wilding pine growth.
There is an increased distance between unfinished seawall and clay bank in the 2021 photo. Loss of clay bank. Subsidence affecting stability of trees.
Since 2013 more bedrock has been exposed adding about a tonne of clay sediment to the Estuary. Wilding pines and gorse are the dominant species. An exposed root at the top of the bank indicates 20-50cm retreat.
The 2021 photo shows an increase in mangrove coverage and a reduction in flax.
Note these images are over a different time period. Omaru Island is clearly eroding (source data on GeoMaps).

My best guess would be about 30cm of loss over the seven year period suggesting the prediction to be about right.

The report suggested a ‘Do nothing’ option which was adopted by the Local Board.  The exposed banks are at least 100m long and average about 2m high. If we lost 30cm of bank over the last seven years that’s 60 cubic meters of clay and top soil. Wet excavated clay weighs 1,826 kg/m³, so more than 100 tones of life choking sediment dumped into the Tāmaki Estuary and the Hauraki Gulf (on our watch).

This report has been submitted to the Maungakiekie-Tāmaki Local Board.

Update September 2022. I was invited to present this report to the Local Board a year later. It was well received and has been recorded in their minutes.

What’s at the bottom of Jones Bay Lagoon?

I have driven past Jones Bay Lagoon many times and always wondered what’s down there. It was dredged for shingle from about 1870-1950 and would have had a stony seafloor like Jones Bay. I had heard that the mining might have made the lagoon 20 meters deep. Altho I knew there was sediment around the edges I imagined it was quite stable as most of the receiving catchment has been reforested including the regions best example of a wetland (albeit a small one).

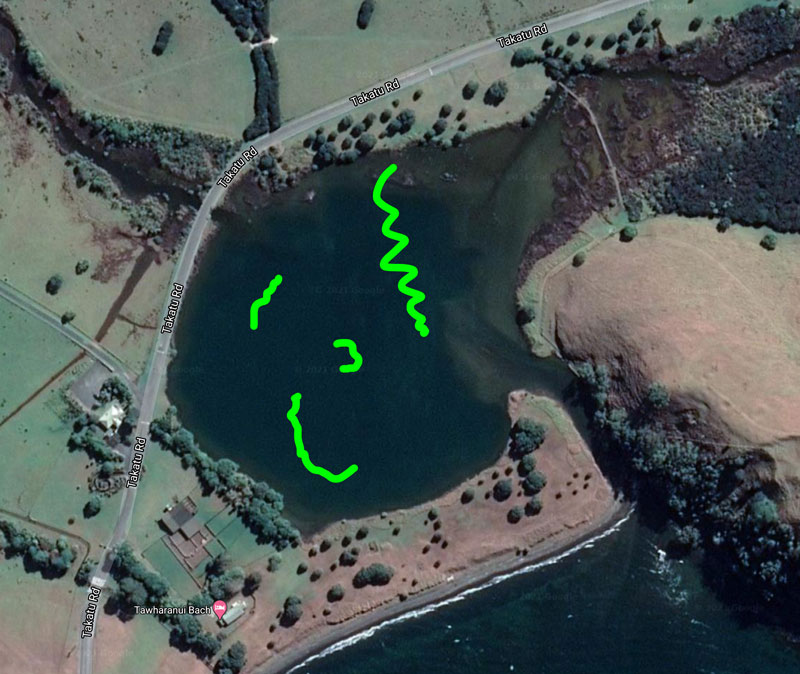
Areas explored in green

I made a few transects at high tide. There was no noticeable current and the visibility above 4m was about 3m. However nearing the 5m mark the visibility dropped to .2m and was not much fun. I was able to easily plunge my hand into the seafloor about 30cm deep before it got uncomfortably sticky and heavy, the mud was very dark grey. The deepest spot I found was 7.5m with most of the lagoon at 5m. The contour of the seafloor varied and did not make sense with the odd ridge appearing in unexpected places.

I saw several fish including, a school of spotty, many yellow-eyed mullet in the shallows, a few snapper, and what I think were estuarine triplefin.

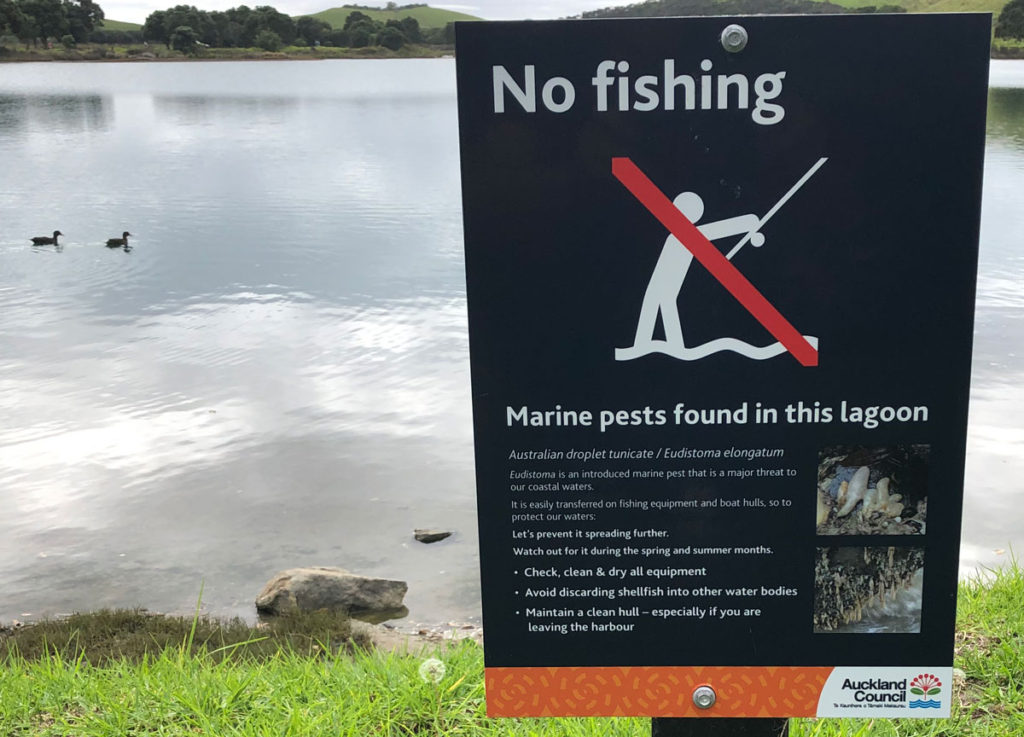
No Fishing. Marine pests found in this lagoon.

The biggest surprise however was the no fishing signs erected by Auckland Council. I was pleased to see them as it has always felt wrong to allow killing of native species in the Regional Park, which is supposed to be a safe place for nature. It was also a surprise given my recent request for Council to start managing the effects of fishing. This sign however is only here to manage a marine pest called Eudistoma or the Australian droplet tunicate.

Eudistoma are the little white things, the stalks belong to Mediterranean fanworm.

I knew that Eudistoma had reached the park because I was alerted by a member of the public on the 4th of February. It was no surprise as they were spreading fast and I documented dense areas of them on the other side of Kawau Bay in February 2019. The lagoon also had large numbers of Mediterranean fanworm (another marine pest) which interestingly often hosted native pleated sea squirts which I have not noticed on fanworm elsewhere. Mediterranean fanworm and Eudistoma are both present in the ocean, meters from the mouth of the lagoon. There was one small cockle bed in a sandy area and several areas with pacific oysters in the shallows. I have asked Auckland Council to comment on the closure which happened in spring 2020.

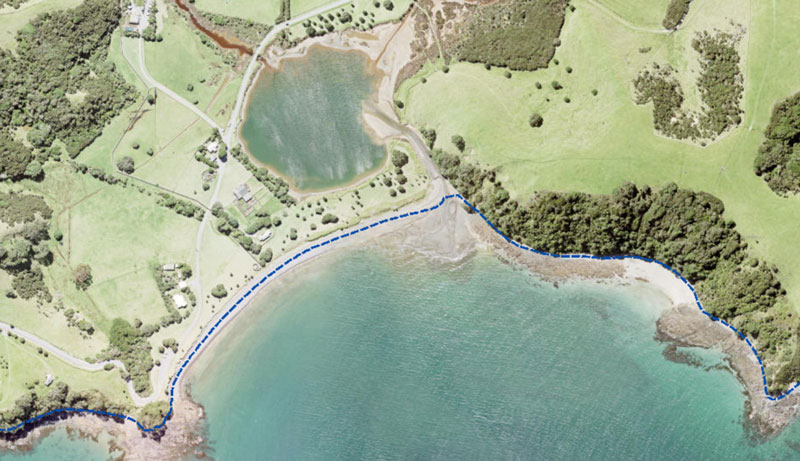
The Coastal Marine Area boundary on Unitary Plan viewer

Response from Auckland Council below.

The coastal marine boundary follows the South Coast/Jones Bay foreshore of Tāwharanui Regional Park, thus the lagoon is within the regional park, or at very least the land around it.

Fishing here is inconsistent with the general Regional Parks Management Plan to not take flora and fauna. The unwanted organism would be a threat to the Tāwharanui Marine Reserve. The regional parkland provides land based access to the periphery of the reserve and there is a real risk of transfer of organism in viable state on wet fishing gear between the two sites. The identification of the tunicate prompted a management response.

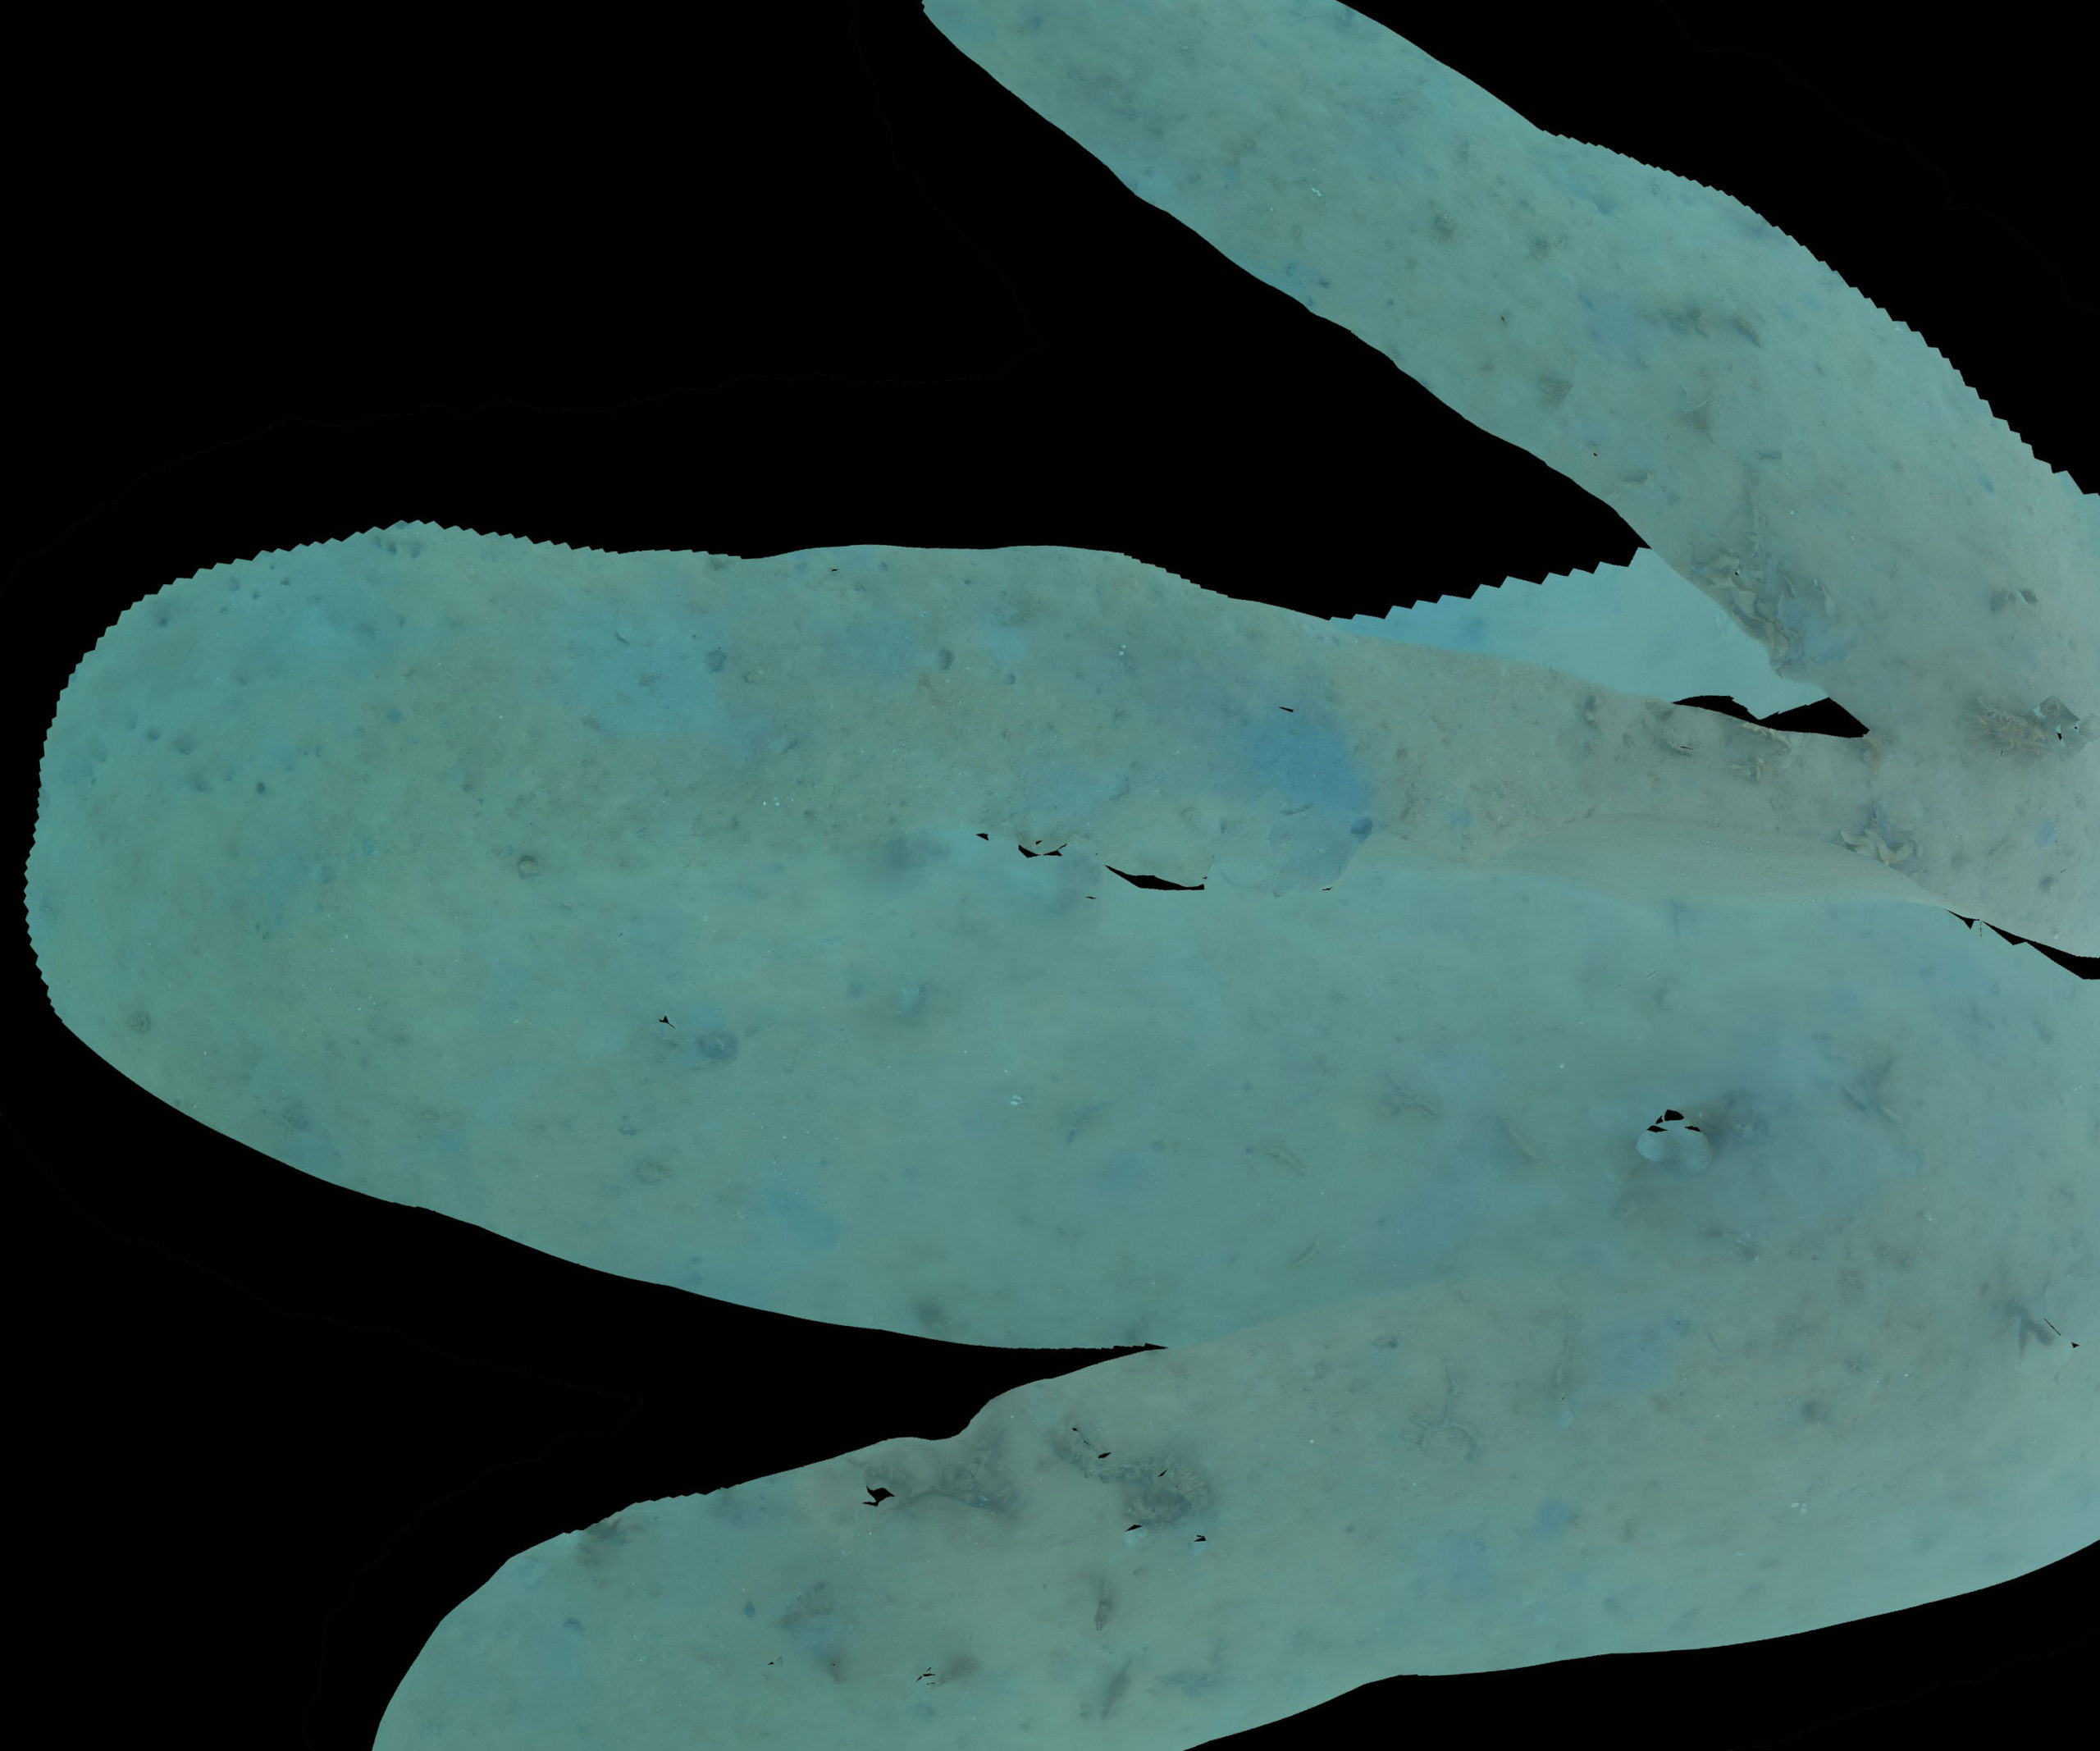
A short photogrammetric transect (4-5m)
Another slightly longer one, the fanworm are not as clear as I had hoped, I need to get much better at over-laping the frames.

I am making sure to decontaminate my dive gear, and I do not recommend the area for diving, in fact I think it might be with looking at the sediment inputs and, if they are low, considering the site for mussel bed restoration.

Stream Health Monitoring guides

As communities get increasingly worried about the declining quality of their waterways there is more interest stream health assessments. I am a huge fan of the Waicare Invertebrate Monitoring Protocol (WIMP) which is simple enough that school students can use it. However the Waicare programme has been largely defunded by Auckland Council and there is no way for the public to share WIMP data. NIWA and Federated Farmers of New Zealand have put together https://nzwatercitizens.co.nz/ based on the New Zealand Stream Health Monitoring and Assessment Kit (SHMAK). It is great but incredibly hard to use, the manual is horrific. I believe this is being addressed but will take years. To help, the science learning hub has made this great guide for teachers and students. NIWA have put together some videos. They are not published together anywhere online so I have posted the list below: