This baseline study helped galvanise Council and Community around the issue and has gone surprisingly well.
It would be good to follow it up later in the year to see if the behaviour changes stick.
Mostly just stuff I am doing to help the planet
This baseline study helped galvanise Council and Community around the issue and has gone surprisingly well.
It would be good to follow it up later in the year to see if the behaviour changes stick.
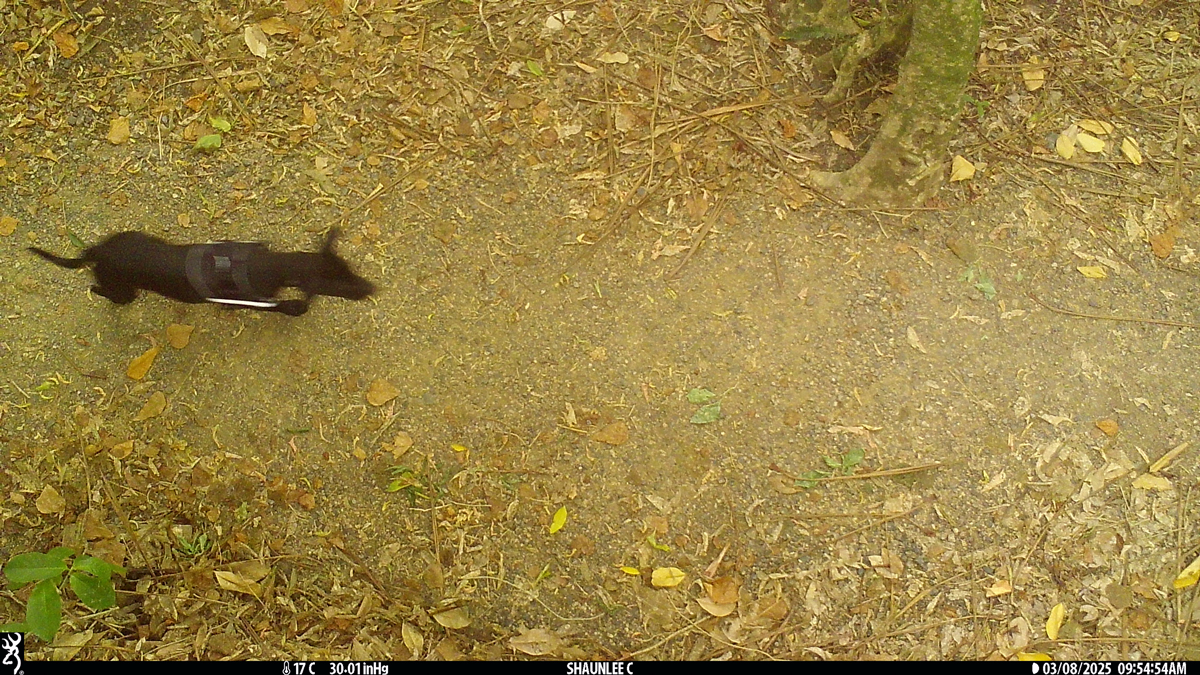
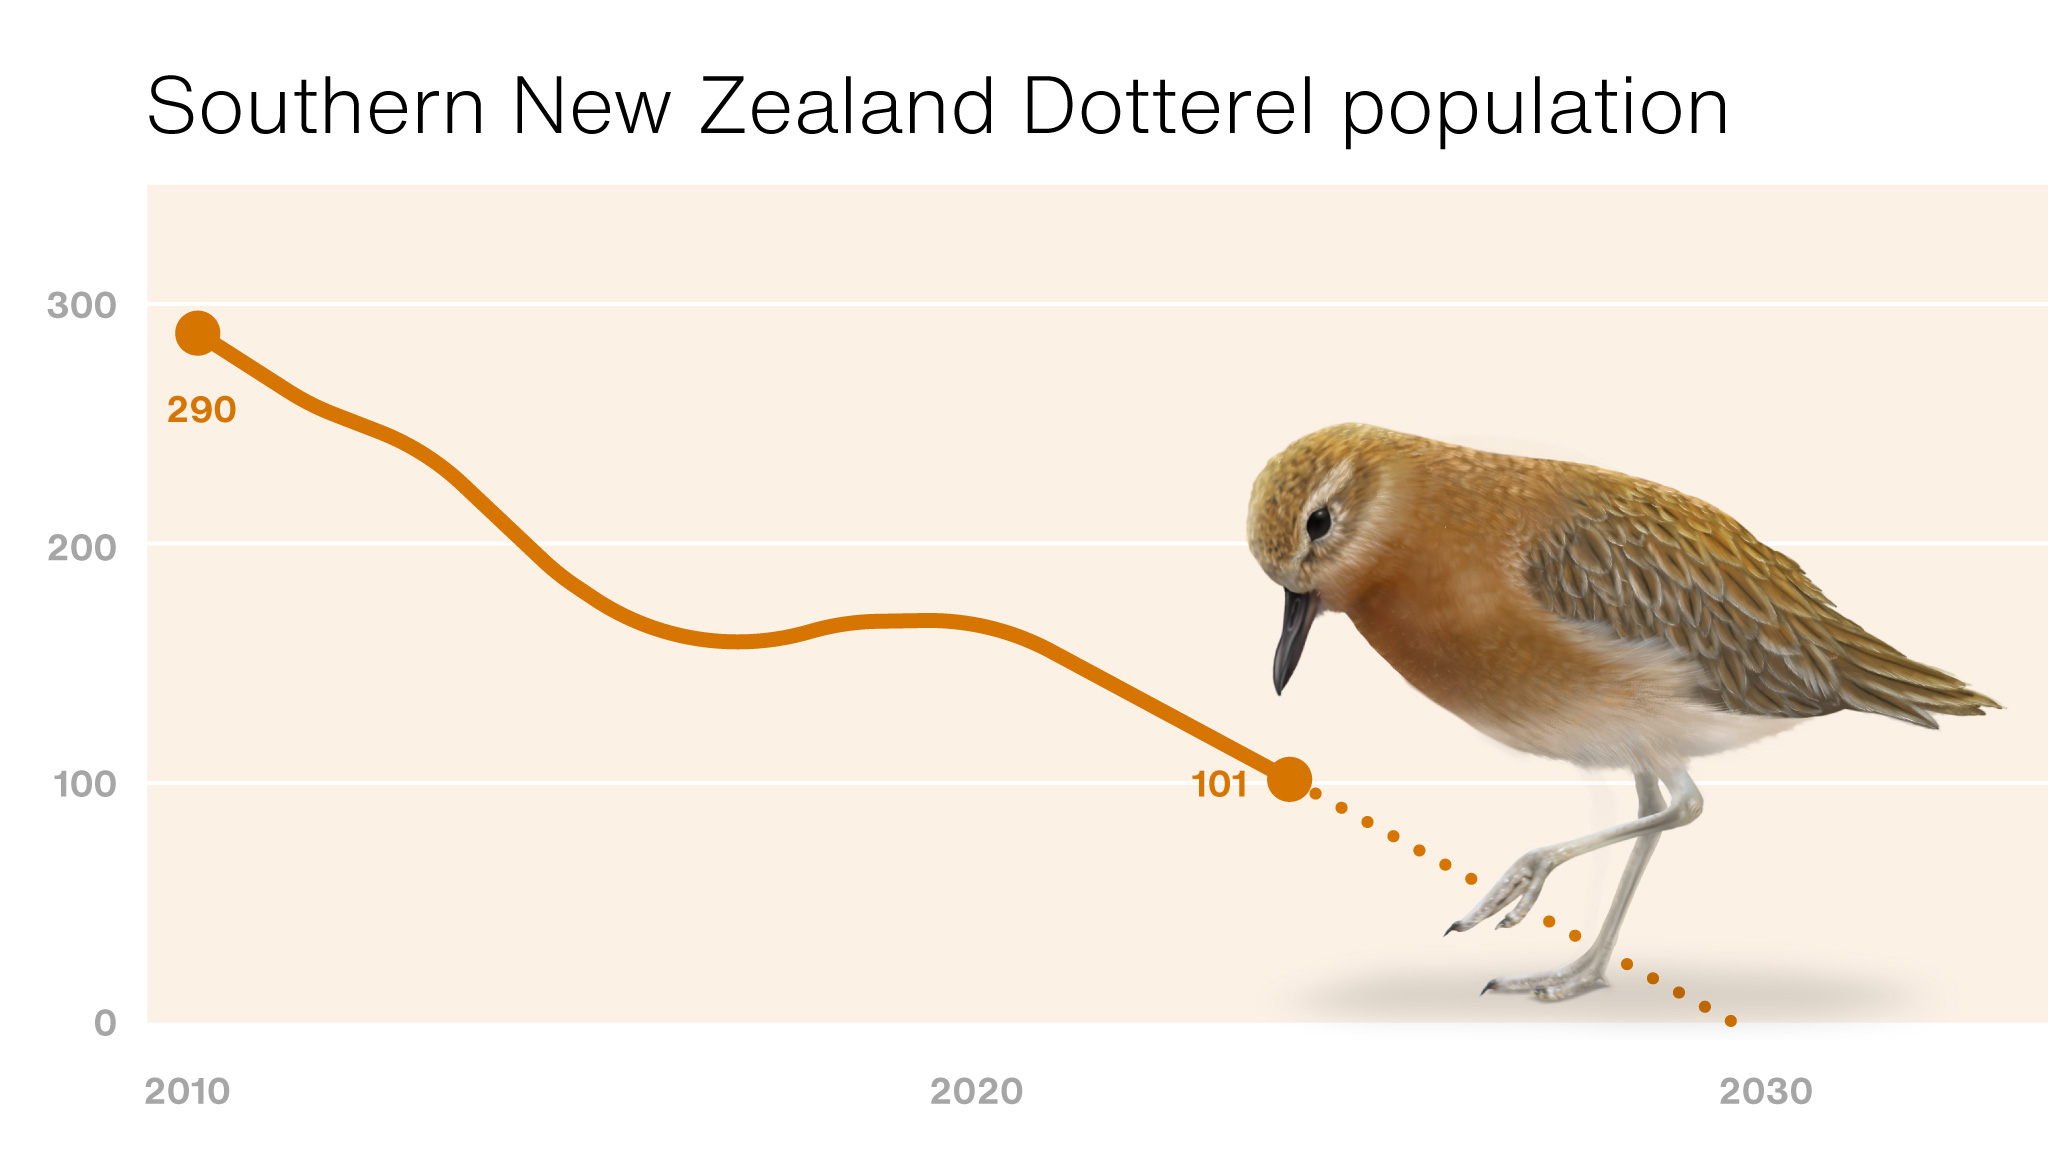
For the past few years, I’ve been supporting the campaign to raise awareness of the critically endangered Pukunui / Southern New Zealand Dotterel, and to see it recognised as New Zealand’s Bird of the Year. Unfortunately, the species is in a dire state and is on track for extinction within the next decade without urgent action.
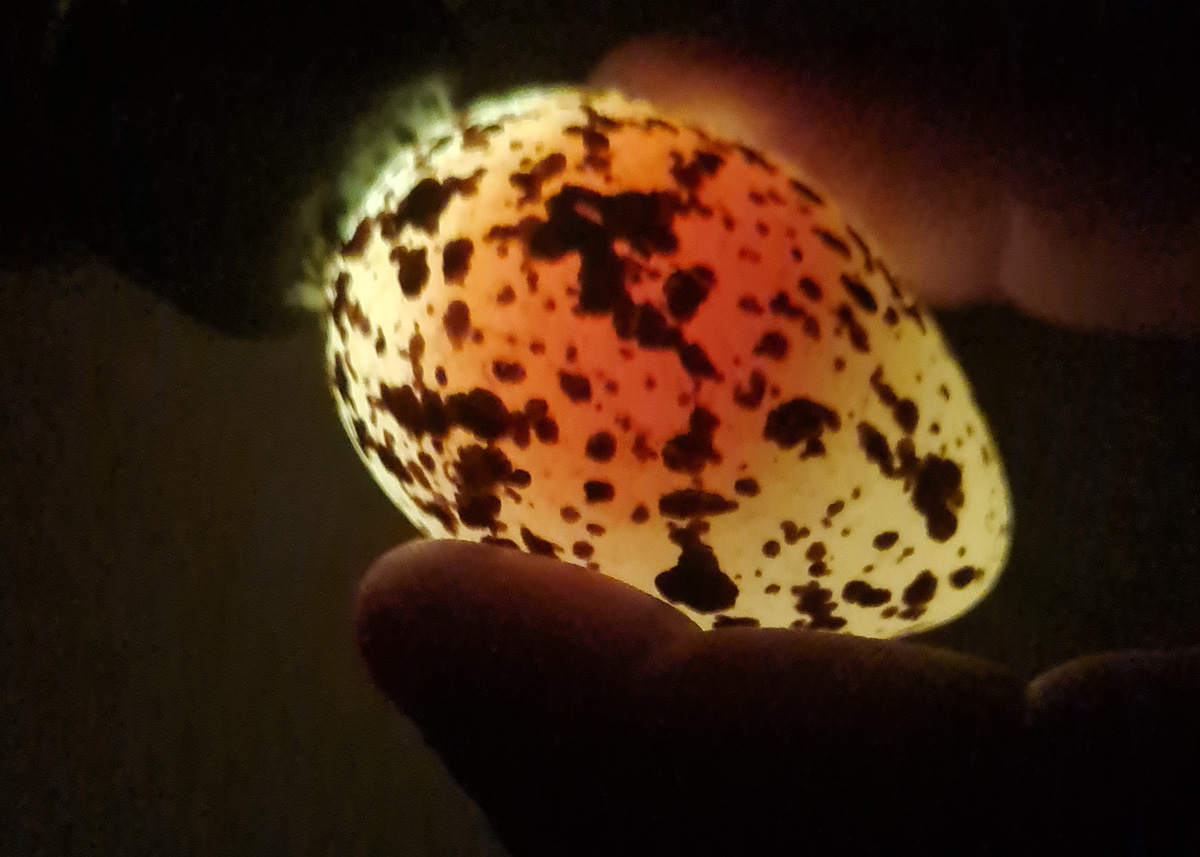
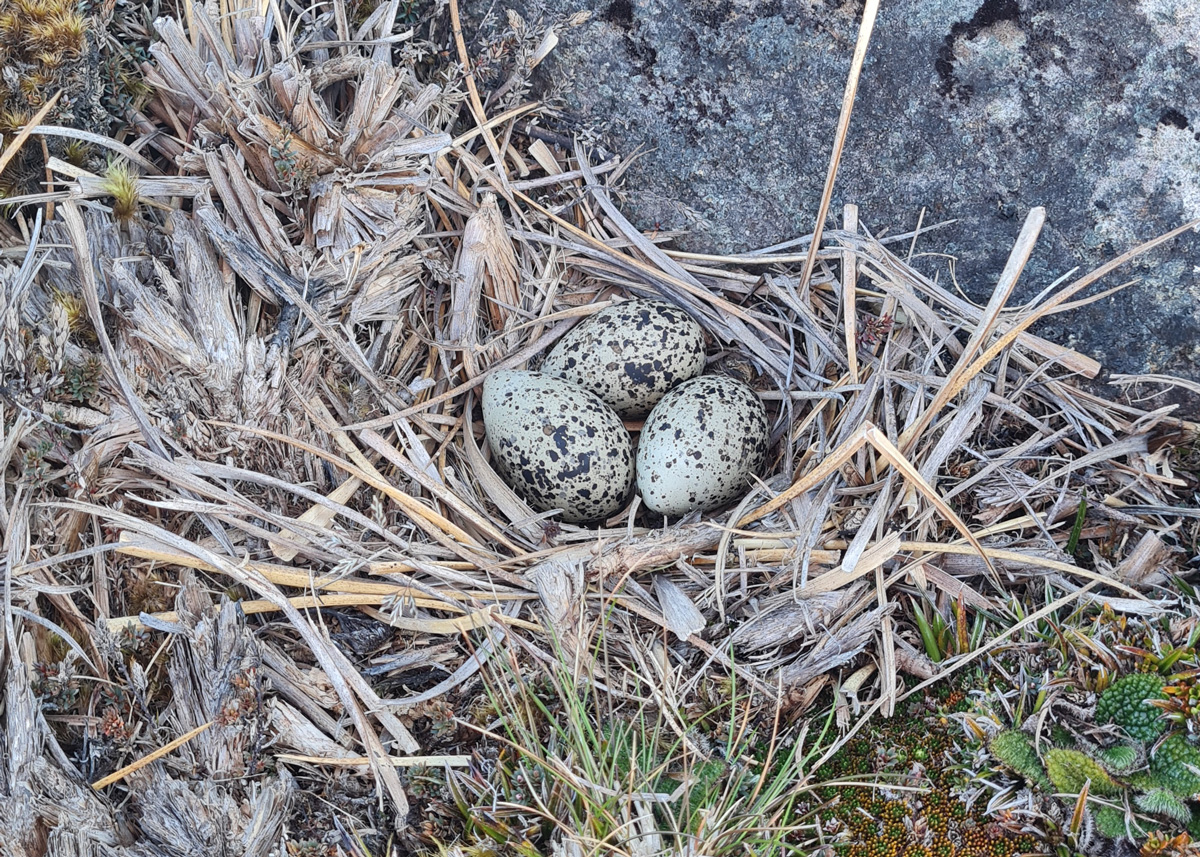
Wanting to contribute in a meaningful way, I offered to produce decoy Pukunui eggs that the Department of Conservation (DOC) rangers could use to distract predators (primarily feral cats). However, DOC staff explained that decoy eggs would be most valuable during fertility checks, providing a substitute to keep adult birds settled on the nest while real eggs were removed for assessment. With only 12 nests found during the 2023/24 breeding season, it’s essential that each actively managed nest is as productive as possible. Ensuring birds aren’t incubating infertile eggs reduces wasted effort and limits their exposure to predators. Candling is only carried out when a bird has been sitting longer than the expected incubation period, suggesting the egg may not be viable.
Using publicly available data on NZBirdsOnline, I 3D printed a set of six replica eggs, carefully matching the size, shape, and weight of real Pukunui eggs. Each egg was then airbrushed and speckled with acrylic paint to resemble the real thing as closely as possible. I also created custom protective cases for each egg to ensure they could be transported safely to Rakiura and carried in rangers’ backpacks during fieldwork.
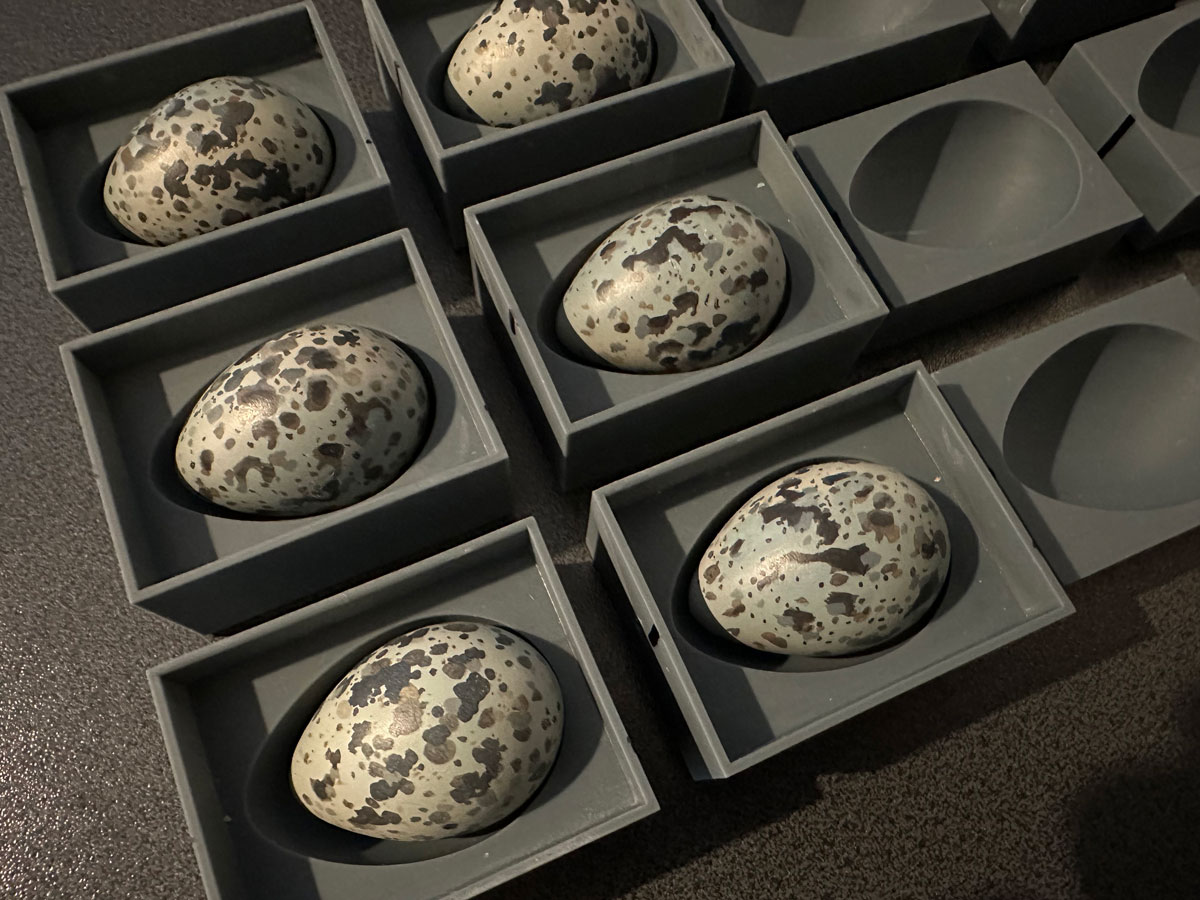
According to the rangers, the decoy eggs have been effective in keeping the birds settled during fertility checks, giving staff the time they need to carry out this crucial work without disrupting the breeding process.
I’m proud to have volunteered my time to support the recovery of this remarkable species. You can help too by donating to the New Zealand Nature Fund.
My advice from an iNaturalist workshop I helped deliver:
You need an email address to sign up to iNaturalist. The platform doesn’t send junk email. It’s a friendly and positive online community that the New York Times called the ‘nicest place on the internet‘.
Observations must be wild, no pets please! But escaped biosecurity threat like turtles and parrots are great. Animal tracks or feathers also interesting. If you are in the garden then just tag your ID as captive/cultivated.
Respect nature – don’t disturb wildlife or habitats for a better photo.
Take photo then upload. If possible take photos from multiple angles. Everyone is always learning about photography, don’t feel self conscious, just do your best.
Add notes about behaviour. Try not to move the subject as the backgound of the photo can help give context.
Size is sometimes really helpful, especially with animal tracks. Hard core people take a ruler, I know a guy who has a ruler tattoo!
If using a phone or GPS enabled camera it will automatically add the location. This is great. If not you can add it manually using a map. Don’t worry if its a protected species like a Gecko that you should not tell people about the location of. iNaturalist will automatically hide the location of those species from poachers.
iNaturalist will automatically ID the animal based on other peoples photos. It sometimes does a bad job but other times it’s amazing, even without leaning on the rest of the community you can learn heaps about the natural world by just using its eyes. If your not sure what something is try and put it in a group, so for example you might not know the species of bird but if you know its some kind of bird just say its a bird.
If other people agree with your ID then it will get made Research Grade which is great. Don’t feel bad if it gets corrected, even the top scientists get stuff wrong, we are all just learning. Also don’t feel bad if no one ID’s it. Some of my observations of weird insects don’t get ID’d for years until a researcher is looking into that space and then they find the data really valuable.
By default your photos are shareable but its better to make them CC BY 4.0 if you want them to be used by researchers and other platforms like Wikipedia. It’s really cool when you look up a species name on Wikipedia and see your photo there. My photos get used by Newspapers and by community groups doing conservation work, I have a Google Alert set up for my name and its nice to see people using my photos for good work and crediting me.
I don’t really use the app very often because I have fancy cameras but the phone cameras are getting really good, especially for taking photos of little things. Most people are using phones. I use the website which is awesome, I follow some adventurous people who go to interesting places and see quite cool stuff, I also follow people in my local community so I know when someone finds something interesting near me.
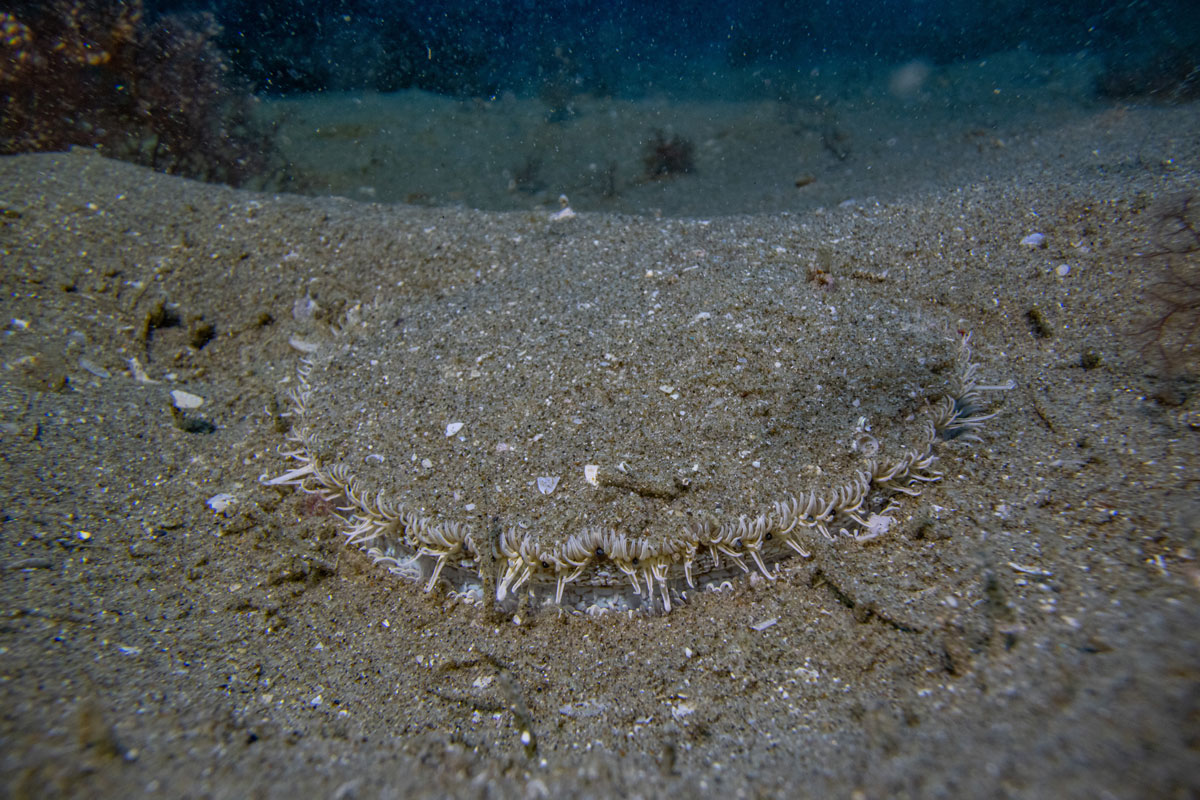
The New Zealand government has just introduced ‘fast track’ legislation to bypass the usual checks and balances for environmental protection. This means less voice for nature in the application and approval process. To help address that gap, I’ve been looking into the impact a proposed sand mine might have on the tipa / scallop population in Bream Bay. I shared the report with quota owners who have been fishing the area, they agreed with my findings and have sent the report to Ministers.
Update: May 2025. I also found this document: Boyd 2017 Commercial-fishing Whangarei.pdf Which shows the location of commercial fishing in Bream Bay.
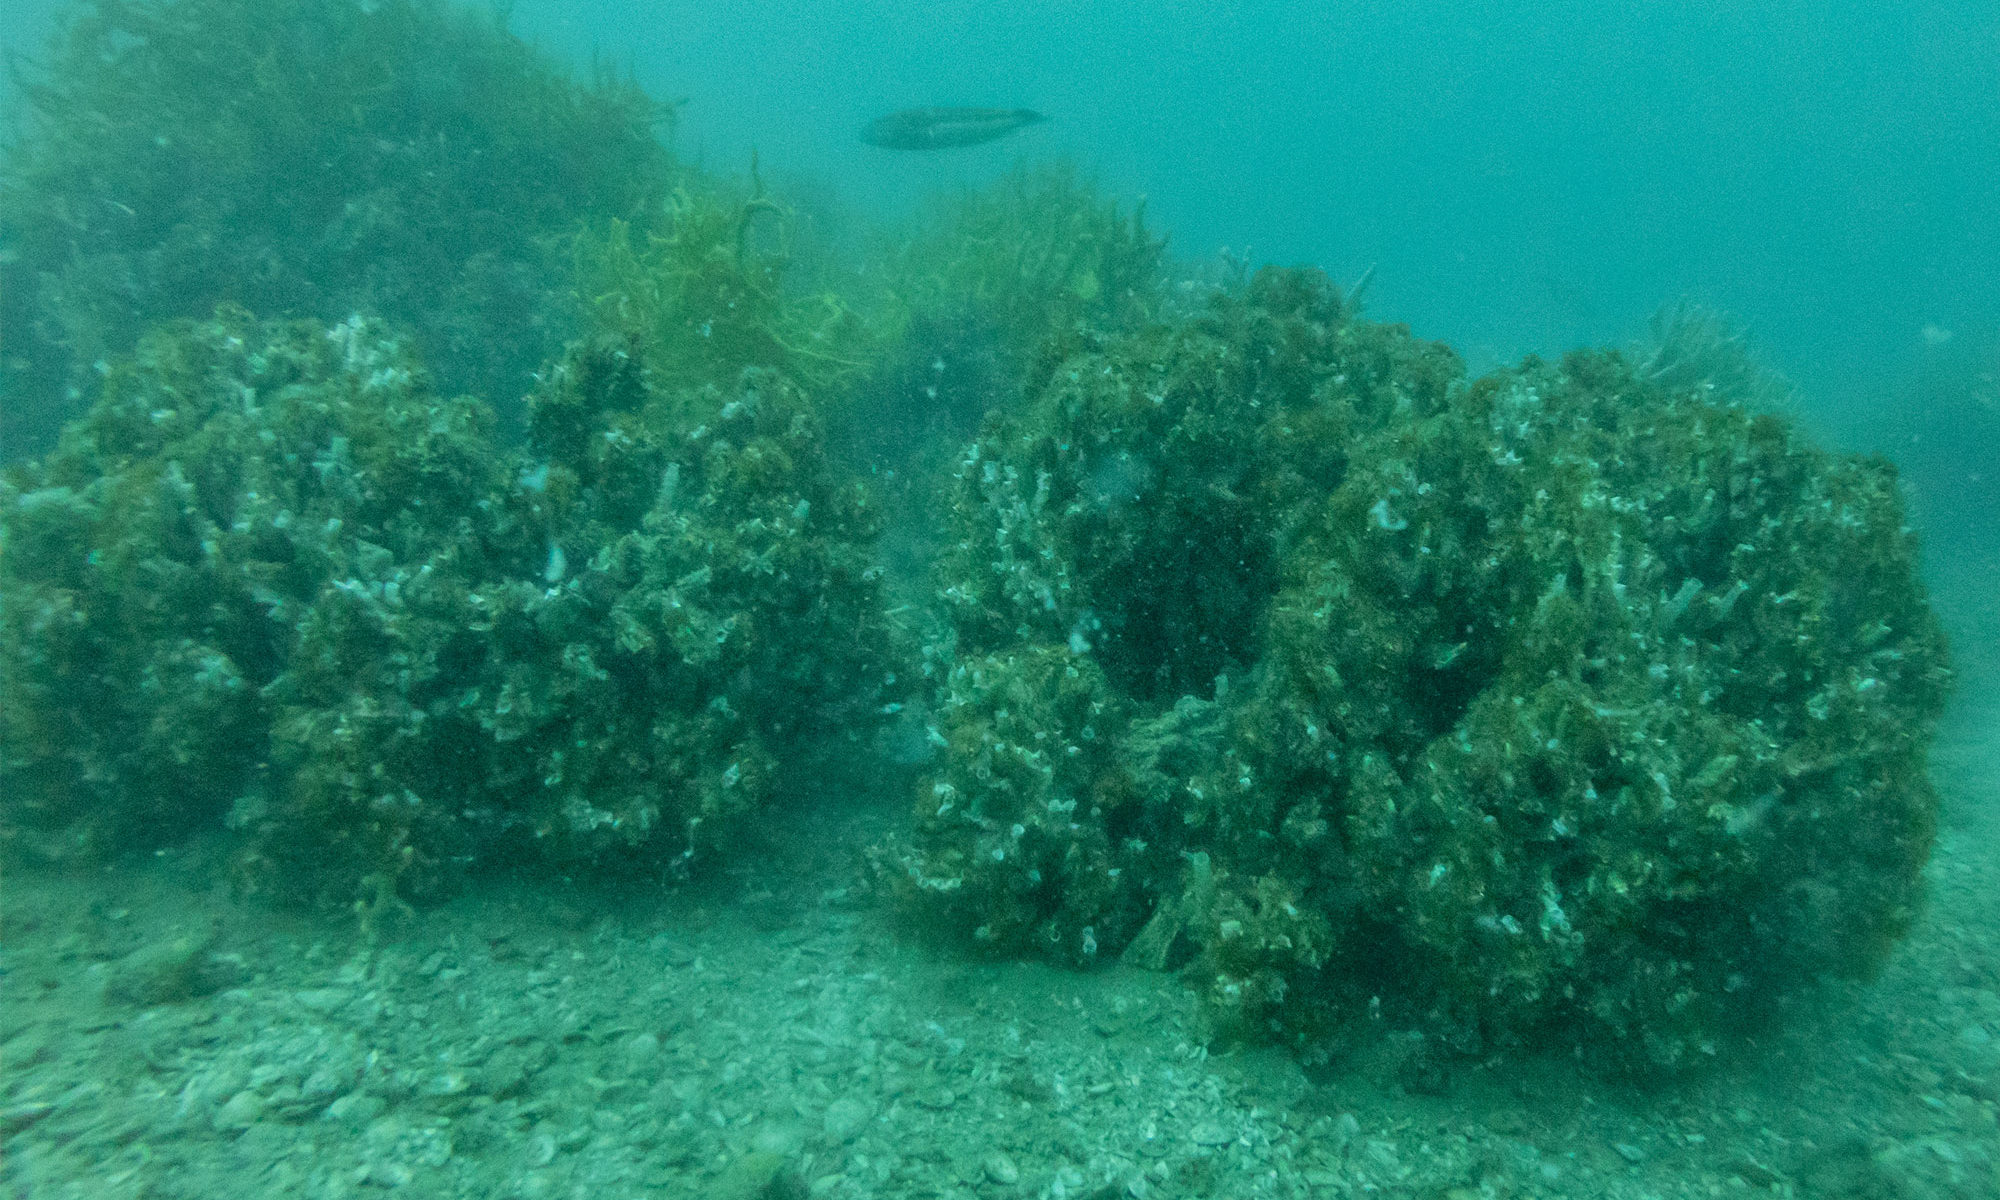
This is an experimental idea for restoring severely degraded seafloor ecosystems in the Hauraki Gulf Marine Park. It was inspired by reforestation efforts in China, where desertification is being tackled using tools like sandbag tubes and straw fences.
The idea I tested was based on the concept of straw fences and how they stabilise loose substrates. Underwater, a similar structure might:
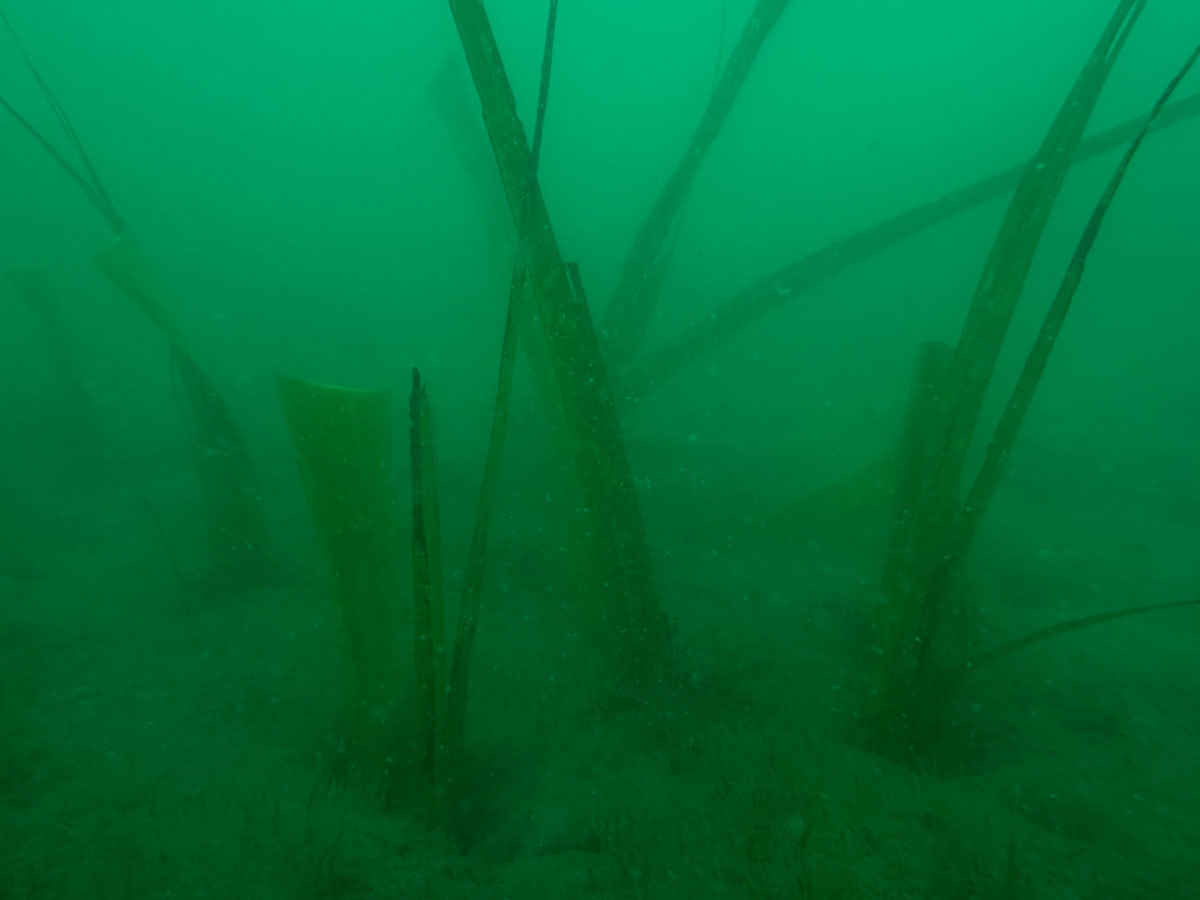
To test this, I needed to see whether natural fibres could be planted in the seafloor and remain in place. I chose tī kōuka (cabbage tree) leaves because they are tough, fibrous, and slow to decompose on land.
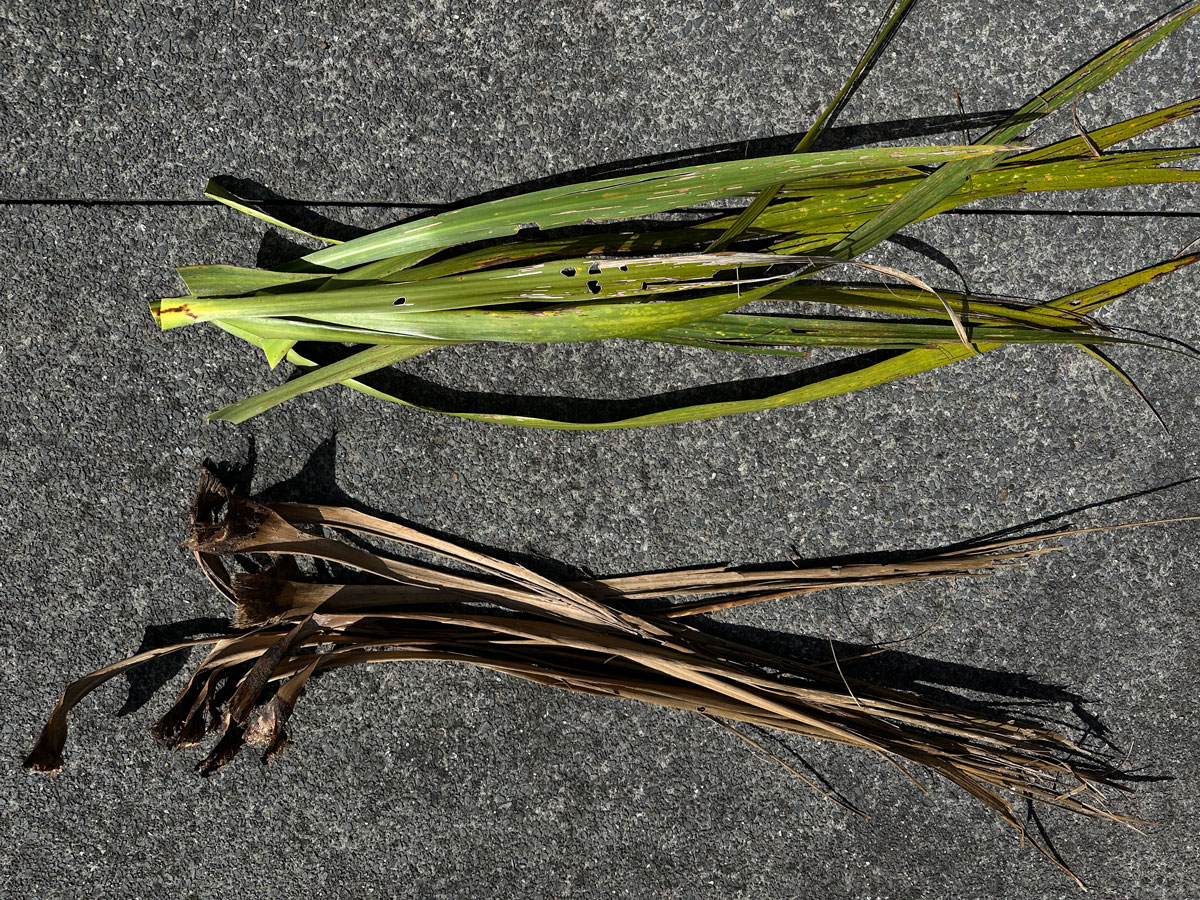
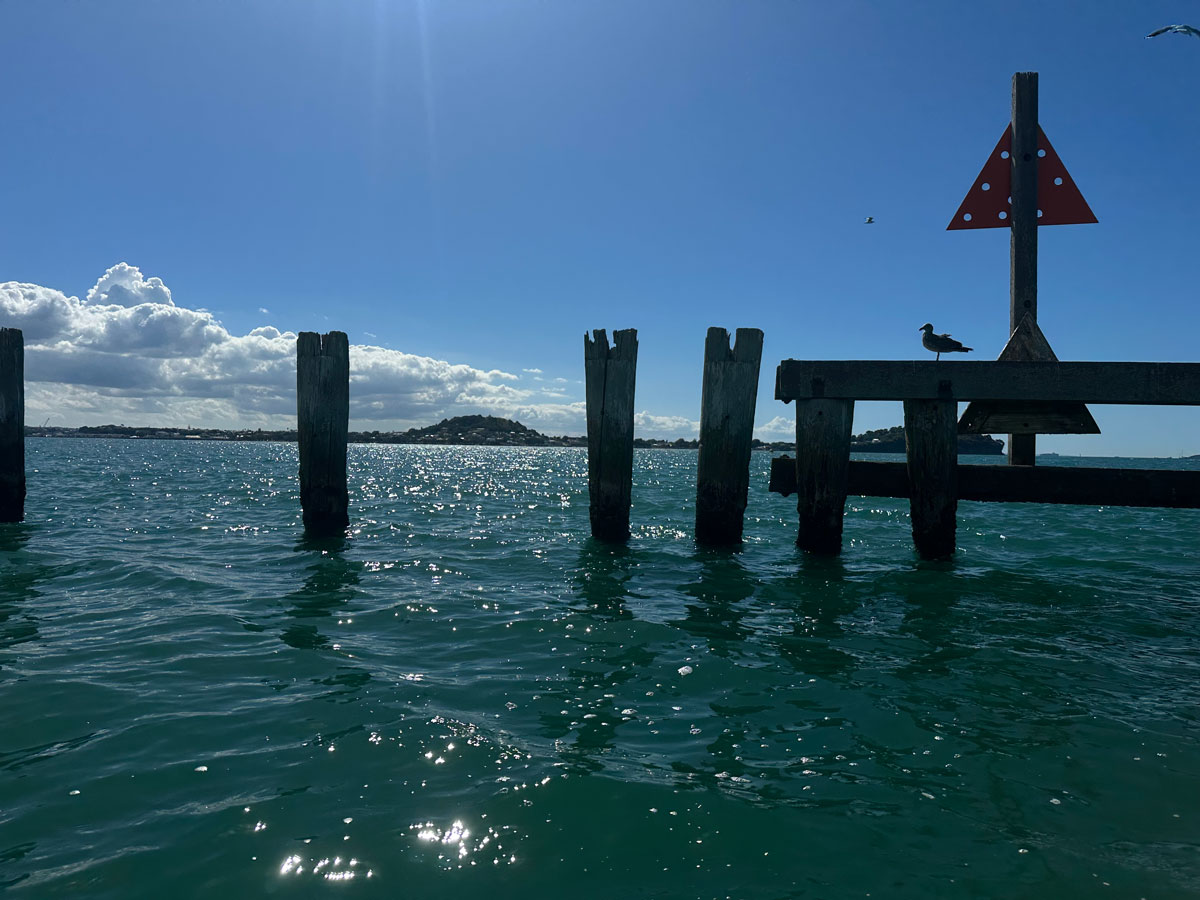
I collected ten live leaves and ten dead ones, plus two extras to bind them into bundles. The leaves were 67–80 cm long. I kayaked to the triangle marker on the Ōkahu Breakwater (-36.84498185012416, 174.8125985293282) and selected a site 10 metres north of this point, where the substrate shifts from broken shell (common around the piles) to soft mud.
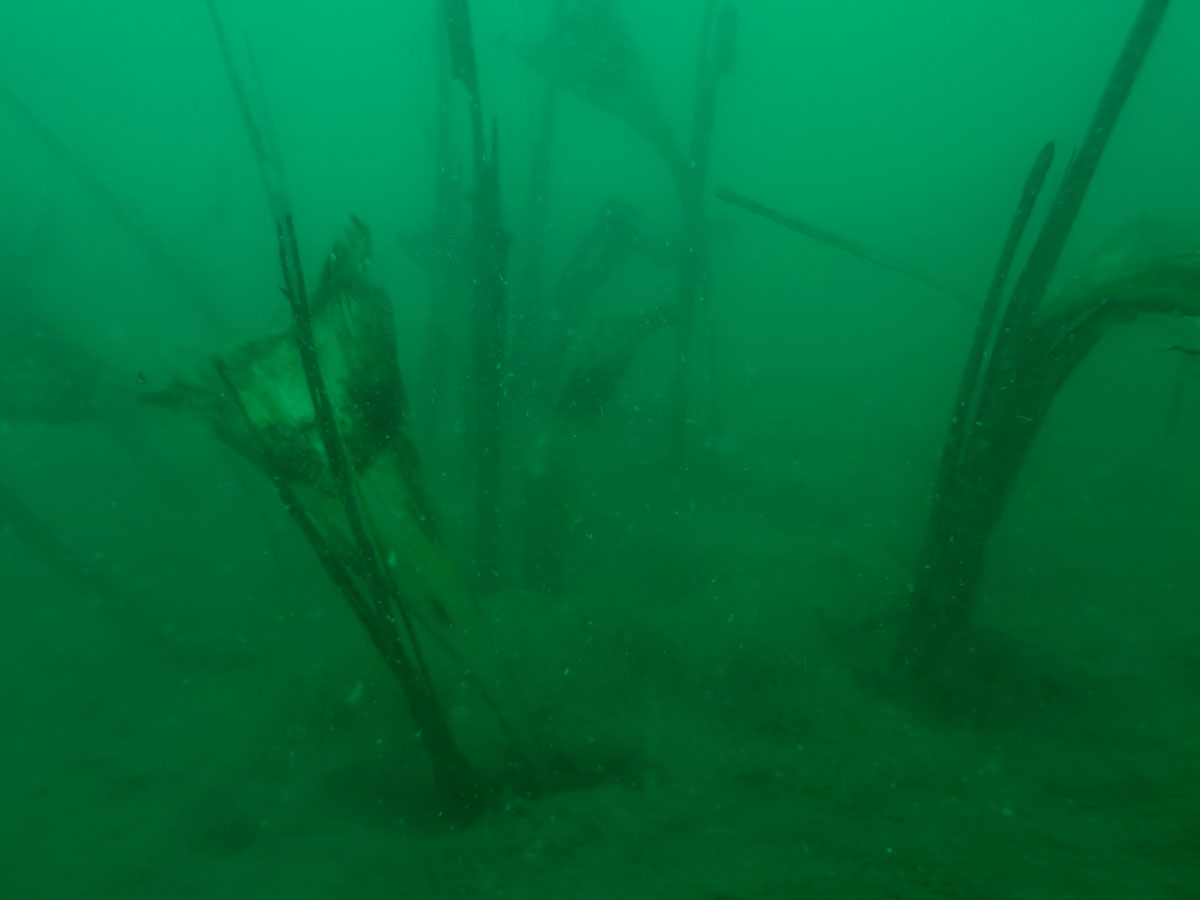
On a calm, high-tide day 25 March 2025, I dived to 5-6 metres and planted the leaves vertically into the mud using a 2 × 2 cm, 40 cm wooden stake, driving each leaf 15–20 cm into the sediment.
The live leaves were planted in a cluster with 5–10 cm spacing. The dead leaves were placed in a similar cluster 1 metre east of the live group.
Now I wait for nature…

STET Ltd opposes all proposed amendments to the Fisheries Act. The changes prioritise commercial interests over ecosystem health, weaken regulatory oversight, and reduce public accountability. Key concerns include:
STET urges Fisheries New Zealand to adopt science-led, precautionary, and ecosystem-based management that upholds public interest over industry lobbying.
My speech to commissioners in the Waikato Regional Coastal Plan hearing on including fishing controls. There was some mention of tubeworm mounds beforehand so I also gave the commissioners an off-the-cuff intro to these ones which was appreciated.
Change in commercial landings in Waikato CMA 2005 to the most recent fishing year

Over the summer I read Lucy Baragwanath’s copy of Seacoast in the seventies – the future of the New Zealand shoreline by John Morton and friends. It’s a fascinating insight into the pressures on Auckland’s coastline in the early 1970’s. The book mentions an upcoming study on the ecology of the Auckland Harbour. Lucy and I were able to track it down and Paul Kennedy kindly let me borrow his copy.
The Waitemata Harbour Study 1973 by M. F. Larcombe is an incredible record of the intertidal zone but it’s very hard to read because, not only are there a lot of scientific names many of them have changed over time. I used records from iNaturalist.nz to make a visual alphabetic key with updated names to make it easier to read. For some reason not a single scientific study on Google scholar references the study. I hope that changes.
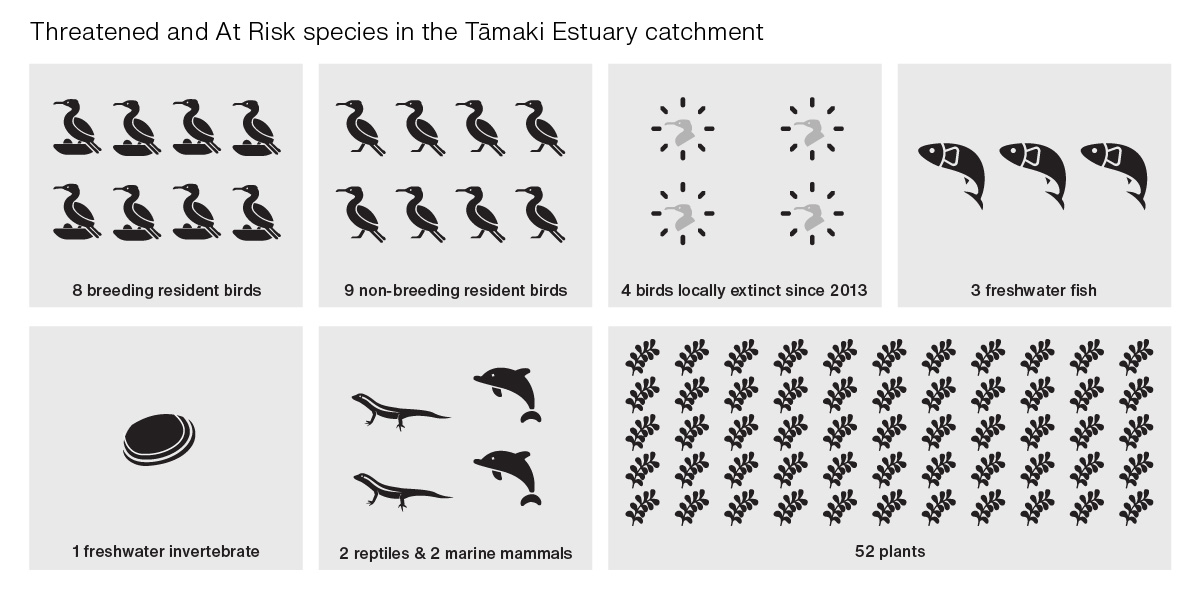
I’m so grateful to Ben Goodwin & Amanda Choy who helped me collate the Threatened and At Risk species of the Tāmaki Estuary for the Tāmaki Estuary Protection Society.
The proposed Resource Management (Consenting and Other System Changes) Amendment Bill threatens to strip regional councils of their ability to regulate fishing impacts under the Resource Management Act (RMA). This shift would place decision-making solely in the hands of the Ministry for Primary Industries (MPI)—an agency primarily focused on fisheries extraction rather than ecosystem health.
This change ignores a key legal distinction: RMA-based marine protections are not about fisheries management but about safeguarding biodiversity, cultural values, and ecosystem integrity. The Motiti Decision confirmed that councils have the authority to protect marine habitats from fishing when necessary to maintain indigenous biodiversity.
The Fisheries Act has failed to protect marine biodiversity, as evidenced by the expansion of kina barrens in Northeastern New Zealand and the complete collapse of the commercial scallop fishery. If councils lose the ability to implement marine protections under the RMA, these problems will only worsen.
New Zealanders overwhelmingly support better marine protection, yet only 0.4% of our oceans are fully protected, placing us behind international standards. The Bill would make it harder to achieve meaningful protections, contradicting both public expectations and international commitments like the 30×30 initiative.
The RMA already allows for 10-year marine protection areas, providing a practical and adaptable tool for ecosystem recovery. Removing this mechanism would take away a proven, community-driven conservation tool.
We oppose the Bill and urge the Select Committee to reject these restrictions, retain regional councils’ ability to manage fishing impacts, and ensure marine protection remains in the hands of local communities—not just the fishing industry. Now is the time to strengthen protections for our oceans, not weaken them.
The STET LTD submission
Make your submission here
UPDATE: Speech presented 03/03/2025