Missing data from Revitalising the Gulf consultation

During the October 2022 consultation round on the marine protection proposals for Revitalising the Gulf I asked Govt a few questions. Some of them were quickly answered but a few others were converted into an Official Information Act request. From that I was able to draft this table showing changes in spatial use of the Gulf proposed by the plan, this is important given it’s a Marine Spatial Plan.

A new idea proposed in the plan (based on Sea Change 2017) was that customary fishing could take place withing the High Protection Areas (HPAs). There was no advice provided on how much customary take might happen in the HPAs, this is important as it impacts level of protection provided by the policy. I asked:

“Are you able to supply how much customary fishing (including commercial customary) was undertaken in the proposed HPAs in previous years? This would aid conversations with people concerned about future levels of customary take. I understand catch records may not have precise associated location data, an estimate is fine.”

I received a painfully detailed response. Here is the map and raw data, I spent a few hours with it trying to answer my question. In my opinion the data is unusable. For nearly every population there is a unspecified number given for what was taken. For example:

In 2018 & 219 there were 1,064 kgs of snapper taken as customary catch but there is an additional number of 438 with no unit specified.

If we just stick to the kgs and compare data from 2018 & 2019 to contextualise it with fishing data from the last State of the Environment Report there was about one tonne of tāmure / snapper taken as customary catch. Total commercial take of tāmure in the Gulf was about 1,600 tonnes and recreational take was 2,000 tonnes. So customary catch might only be 0.03% of the total catch and insignificant from a population management perspective. However there is another number of 438 given with unit unspecified. If the number is tonnes then customary catch is 12% of the current catch, spatial changes in this effort would be significant from a population management perspective. The 2022 data is also dominated by unspecified numbers.

I have not been able to use the data to answer my question, the reporting system for recreational and customary take needs an over haul. Its frustrating as there is a great app that has been developed for reporting customary take (IKANET) which must be unused.

A Fisheries Management Plan for the Gulf

Fisheries New Zealand (FNZ) is designing an NZ first Fisheries Management Plan for the Hauraki Gulf Marine Park that they are calling Ecosystem Based as part of the Revitalising the Gulf – Government Action on the Sea Change Plan. They are seeking an advisory group as part of their discourse of delay (Revitalising the Gulf was launched six months ago). I have not asked to be part of the process. Because the advisory group does not have any decision making capability it won’t be very effective in managing commercial fisheries (like Sea Change), this is because FNZ has been captured by industry (Parker 2016). FNZ also only want advice from people with experience in Fisheries Management, based on the state of Gulf this is like asking the Tabacco Industry to regulate smoking. But they might be able to reduce recreational catch which I think has the biggest impact on the Gulfs reef ecosystems. Unfortunately of the five voices, only one will be from the environmental sector, so it doesn’t have much of a chance of being ecosystem based, and to be truly ecosystem based; the scope would have to include the management of other impacts on the ocean like plastics and sediment (Government departments have hand picked recommendations from the Sea Change which was the only attempt at an integrated management plan). The plan will start to address the effects of fishing which FNZ should have been doing since the act was established in 1996. The Sustainable Seas Challenge has a project investigating what Ecosystem Based Fisheries Management would look like for the Gulf, it’s so political even the scientific proposal is two months late.

The outcomes of the proposed plan are:

  • Healthy, functioning aquatic environments that support sustainable fisheries
  • Fish stocks at levels which meet the needs of treaty partners and stakeholders
  • Inclusive and integrated regional participation in governance of fisheries

Like more than 10% of New Zealanders I don’t eat our native wildlife, my suggestion for creating a really Ecosystem Based Fisheries Management Plan would stop all fishing in the Gulf and not be very popular 😀 So here are some ideas that might be a bit more palatable. First of all my outcomes would be different:

  • Clearer water
  • Restored kelp forests (no kina barrens & carbon sequestration)
  • Increased biodiversity and intact ecosystems
  • Increased abundance
  • Climate change resilience

Obviously we need to stop bottom contact fishing (as per Sea Change and the Hauraki Gulf Forum goals) but on top of that, this is what I would do to achieve the above outcomes.

Provision 1: No more killing of functionally extinct native wildlife and habitats.

These species need to recover to much higher levels to perform ecosystem services and increase biodiversity. Species I consider functionally extinct. Kutai / Green-lipped mussels, Kōura / Spiny rock lobster and Packhorse rock lobster, Hapuku, Sharks etc.. Where populations of species are not known fishing should stop (precautionary approach) and the group complaining about the closure should pay for the science to measure it (user pays). Many species are in such a bad state we now need to also stop fishing practices that might kill them as bycatch (eg. Killing juvenile Hapuku who have a pelagic phase in Purse Sein nets). The sooner we stop killing the species the sooner we will see them recover. The advisory group will suggest long rebuild times for populations so they can keep killing as much as they can for as long as possible. I would stop all killing right now and wait until stocks have recovered to 80% biomass and there contribution to ecosystem function has been measured before considering harvesting again.

Provision 2: Reductions in the take of food for functionally extinct native wildlife.

This has been said before but just for marine mammals “Management of the Greater Hauraki Gulf should take into account the potential for trophic and system-level effects of re-establishment/recovery of marine mammals towards historical levels.” MacDiarmid 2016. I think it should apply to other functionally extinct predators like Hapuku.

Provision 3: No more killing native filter feeding animals that live on the seafloor.

Not everybody will love this idea but everyone will love the result – clearer water. The Gulf has been overloaded by sediment and nutrients and the tap is still running. Filter feeding animals help clear the water by removing sediment from water while looking for food (mostly phytoplankton).

Increasing populations of filter feeders that live on the seafloor, Kutai / Green-lipped mussel, Tipa / Scallop, Tuangi / Cockle, Hururoa / Horse mussel, Tio / Oyster etc will increase water clarity which will increase kelp biomass and carbon sequestration. Other benefits include more complex benthic habitats which are nurseries for fish, removal of harmful pathogens and even the production of sand. Increased water clarity benefits visual predators like Tāmure / Snapper and Human spearfishers.

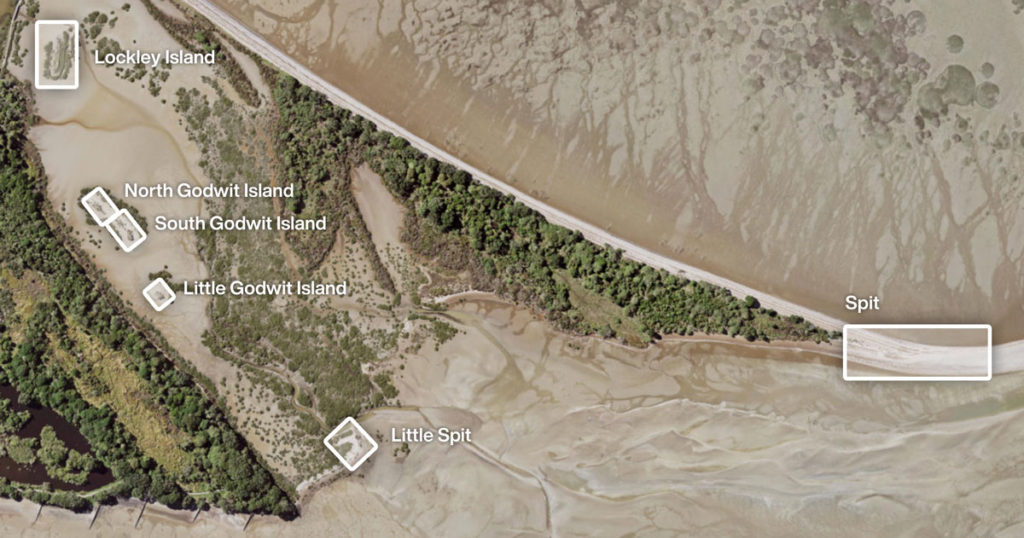
In some parts of the Gulf a lot of money is being spent trying to actively restore shellfish, by not killing shellfish in areas where we still have remnant populations we can increase larval supply across the Gulf. Passive and active restoration activities are complementary.

Provision 4: Dramatic increases in forage fish populations.

By weight most of the fish in the Gulf are also filter feeders. These forage fish swim around in large schools with their mouths open feeding on zooplankton. Unlike the bivalves listed above they do not bind sediment up in balls and deposit it on the seafloor. This means not all the above benefits of increasing their populations apply, however its likely they play a critical role in the Gulfs ability to sequester carbon. I’m most interested in increasing forage fish populations because they are critical to many Gulf food webs. Commercial harvest of some forage fish like Blue mackerel has increased 300% in the last 20 years. This is reducing the amount of food available to protected species that we want more of, like whales and seabirds. Populations of most forage fish are not known so that would be the first step, I would then set the Total Allowable Catch (TAC) for Ecosystem Based Management (EBM) very low (E.g. 20% unfished biomass) and invest more in monitoring the breeding success of their predators (seabirds and cetaceans) and adjust the TAC accordingly.

Provision 5. Maximum size limits for recreational species.

Restoring Kōura / Spiny rock lobster and Packhorse rock lobster numbers is going to take a long time and they will need help to push back Kina / Sea urchin barrens and regrow our kelp forests. We can fix this by creating a maximum size limit for Tāmure / Snapper. Bigger snapper are better at managing Kina populations and are dramatically better at making baby Tāmure / Snapper. If the later is true for all finfish then it makes sense to introduce the maximum size limit across all species. Recreational fishers could still have fishing competitions but they would have to be catch-and-release. Large fish should learn to avoid hooks overtime reducing harm and selecting for traits that support catch-and-release. R&D would be required to match the gear to fish size for the longline fisheries but as I said earlier this group hasn’t been set up to have the power to influence commercial take.

Provision 6. Effort controls with gear limits.

We need to get much less good at killing fish. Methods like nets, pots and dredges need to be banned along with long lining. Gear restrictions should also apply to methods with high levels of bycatch. This is not just what is used (eg. set nets catching protected bird species) but also how (eg. Let’s stop all fishing in workups and spawning aggregations). This means a lot of re-educating fishers, the introduction of a license would be sensible (like Australia which has had licenses for 20 years and is not known for being progressive on wildlife protection).

Provision 7. A network of Marine Protected Areas covering at least 30% of the Gulf.

Source–sink dynamics are not hard for anyone interested in population management to understand. No-harm areas where populations can reach near 100% of their un-fished state can feed exploited areas. No one would design a conservation management plan on land without a wildlife refuge. I don’t see why the design of network of such areas should not be part of an ecosystem based population management plan in the ocean.

“It would be logical to close some scallop beds and create passive restoration (broodstock areas) to increase the fishery yield” 

– Dr Mark Morrison, Shellfish Restoration Co-ordination Group, December 2021.

A recent poll showed that the 30% protection policy had 77% support from the public including Māori. These areas would serve as a reference point to compare the impacts of fishing elsewhere in the Gulf and provide the best possible resilience to climate change impacts like ocean acidification (which scares me more & more every time I look into it). One of the most difficult hurdles for Marine Reserve applications is the perpetual nature of the policy. Creating MPAs under a fisheries management plan would be a lot easier, voices of those seeking protection in the Gulf (like me) will go quiet the longer the areas stay closed to fishing and visa versa.

It’s a good time to share ideas on what an Ecosystem Based Fisheries Management plan would look like. There are some attempts to define it here, but they all try to avoid the idea of simply killing less native wildlife, no one wants to pay for that research.

References

MacDiarmid 2016. Taking Stock – the changes to New Zealand marine ecosystems since first human settlement: synthesis of major findings, and policy and management implications. New Zealand Aquatic Environment and Biodiversity Report No. 170 A.B. MacDiarmid et al. June 2016. Ministry for Primary Industries.

Parker 2016. Hon David Parker https://www.parliament.nz/en/pb/hansard-debates/ rhr/document/HansS_20160920_054787000/parker- david

UPDATE 6 MAY 2022

The Hauraki Gulf Fisheries Plan Advisory Group has been announced. The Chair is an old school fisheries scientist who is responsible for the current fish populations. There are three commercial voices and one (or one and a half) recreational. There are only two voices for serious change. I am not counting on it delivering significant change.

UPDATE 3 MAR 2023

My submission on the proposed plan which refines thoughts I began in this blog post. It includes additional critique of the draft plan and many new measures.

Erosion in Wai O Taiki Bay

A 2016 Tonkin & Taylor report on the erosion of the banks of the Tamaki Estuary in Wai O Taki Bay suggested a 3-5 m/100 year range rate of retreat. I took some photos in 2013 so wanted to see if the prediction looked right for the last seven years.

The 2021 photo has more grass and that the failing fence is not keeping people off the closed track.
The 2021 photo has more exposed bedrock showing a loss of soil. The flax bush is now very exposed to elements and will likely die in the next few years. Soil loss is apparent adjacent to the unfinished seawall.
The 2021 photo shows how the harder substrate has changed its shape. Roosts of dead pine rotting and stumps falling down slope. Wilding pine growth.
There is an increased distance between unfinished seawall and clay bank in the 2021 photo. Loss of clay bank. Subsidence affecting stability of trees.
Since 2013 more bedrock has been exposed adding about a tonne of clay sediment to the Estuary. Wilding pines and gorse are the dominant species. An exposed root at the top of the bank indicates 20-50cm retreat.
The 2021 photo shows an increase in mangrove coverage and a reduction in flax.
Note these images are over a different time period. Omaru Island is clearly eroding (source data on GeoMaps).

My best guess would be about 30cm of loss over the seven year period suggesting the prediction to be about right.

The report suggested a ‘Do nothing’ option which was adopted by the Local Board.  The exposed banks are at least 100m long and average about 2m high. If we lost 30cm of bank over the last seven years that’s 60 cubic meters of clay and top soil. Wet excavated clay weighs 1,826 kg/m³, so more than 100 tones of life choking sediment dumped into the Tāmaki Estuary and the Hauraki Gulf (on our watch).

This report has been submitted to the Maungakiekie-Tāmaki Local Board.

Update September 2022. I was invited to present this report to the Local Board a year later. It was well received and has been recorded in their minutes.

Wader population trends at Tahuna Torea

While researching my latest nature report to the Tahuna Torea Residents and Rangers I found some great bird counts in the reserve made in the 1980’s that had been entered on eBird. Unfortunately an oversight in the design of the website means you need to know a statistical programming language to extract population trend data for a location (however if you are able to stumble across an old checklist you can download the data). At the meeting Chris Barfoot supplied me with a brilliant 1993 report on the reserve which had a new set of data recorded by Micheal Taylor.

This new data adds valuable insight into the decline of waders in the Tamaki Estuary which the Tamaki Estuary Environmental Forum has recently published an article on. I have compiled the data and plotted it for key species below.

UPDATE 23 JUNE 2021. Here is an interesting snippet of history complied by the Howick & Pakuranga Times “Kuaka [bar tailed godwits] and red knots gather on the Cockle Bay estuary in thousands before flying to Korea and on to Alaska to breed each March, to return in September. In February-March they swoop over Point View ridges where farmers used shotguns before the birds were protected in 1941. They were plucked and preserved in their fat in ceramic jars.” Source: https://www.birdingnz.net/forum/viewtopic.php?f=3&t=11024

UPDATE August 2021. More data found in old journals. Graphs updated and presented to the Ōrākei Local Board.

Pakiri horse mussel beds

For the last eight years I have been working on restoring green-lipped mussel (perna canaliculus) beds in the Hauraki Gulf. The main reason we started with that species was that there is a commercial supply. However there is a bigger native mussel that has even more potential than green-lipped mussels, both as a habitat and water cleaner. 

Horse mussels / Hururoa (atrina zelandica) are huge pumps, they are more than twice as big as green-lipped mussels (up to 400 mm in length) but have fragile shells which are vulnerable to fishing gear. They also  don’t move (unliked green-lipped mussels) and are sensitive to changes in substrate.

Last century horse mussel beds were some of the best fishing spots in the Hauraki Gulf. I regularly ask divers about horse mussels; Where did you see them? How dense was the bed? etc. There are spots with horse mussel in the Gulf but I don’t know of any significant beds left, if you do, please let me know about them.

I was recently sent these images of a stunning horse mussel bed in Pakiri.  They are from a report titled “Mangawhai – Pakiri Sand Study, Module 2: Technical Report, Marine Sands” by NIWA 1996. They show a large and dense horse mussel bed that has since been destroyed by sand mining. The beds ran the whole length of the embayment in depths of 15 -20m. I am posting them here to show the kind of seafloor we could have, if we treated it better.

We don’t yet understand the horse mussel lifecycle or what species / substates might attract juveniles. It’s interesting to note: presence of finger sponge and branching red algae, the hard edge to the bed and the way some of the shells align.

Overseas there have been attempts at restoring similar species (photos below). Seachange called for the “Initiation of a horse mussel restoration programme, with an initial focus on the Mahurangi and Whangapoua harbours.” But we could look at restoring any of the sites with historic beds. Wouldn’t it be awesome if we stopped smashing the seafloor, and bought back these giant pumps to clean the water, and create homes for fish.

Stream Health Monitoring guides

As communities get increasingly worried about the declining quality of their waterways there is more interest stream health assessments. I am a huge fan of the Waicare Invertebrate Monitoring Protocol (WIMP) which is simple enough that school students can use it. However the Waicare programme has been largely defunded by Auckland Council and there is no way for the public to share WIMP data. NIWA and Federated Farmers of New Zealand have put together https://nzwatercitizens.co.nz/ based on the New Zealand Stream Health Monitoring and Assessment Kit (SHMAK). It is great but incredibly hard to use, the manual is horrific. I believe this is being addressed but will take years. To help, the science learning hub has made this great guide for teachers and students. NIWA have put together some videos. They are not published together anywhere online so I have posted the list below:

Fires at Point England

On the night of the 5th of April 2020 I noticed emergency services lights at Point England. Today I counted three areas of previously un-mowed grass on the south-eastern end that had been burnt and two partially forested areas on the northern end. The fires look like intentional arson to me, with drought conditions over hopefully we wont see any more burning. I’m very disappointed to loose some of the trees I planted. Damage to fences (including an area removed by emergency services) needs to be fixed before the dotterel breeding season begins (Auckland Council reference: 8110308091). I’m grateful to emergency services for managing the fire risk and to the mowers who have kept the tinder dry grass very short.

Roost heights at Tahuna Torea

Today I took photos of the shorebird roosts at Tahuna Torea when the tide had just covered the main spit roost. The tide height was predicted to be very high today (3 August 2019) at 3.4M Westhaven 8:53am. Conditions were relatively calm and the tide had not (yet) hit the high tide line on the Little spit.

Names and locations of roosts
The tide was about 20cm (in height) from the high tide line.
Pathway
And the pathway which is sometimes flooded was about 20cm above the water.
The spit had just been compromised with just a few Black-back gulls and one Caspian tern remaining
Little spit was about 50cm above the tide
Little Godwit Island was about 60cm above the tide
South Godwit Island was about 75cm above the tide
North Godwit Island had about 40cm above the tide
The Southern end of Lockley Island had about 40cm above the tide
The Northern end of Lockley Island had about 40cm above the tide

I have seen tidal debris in the mangroves around Lockley Island that were above the height of the island (indicating that it sometimes gets swamped) but I think it would have made an ok roost today.