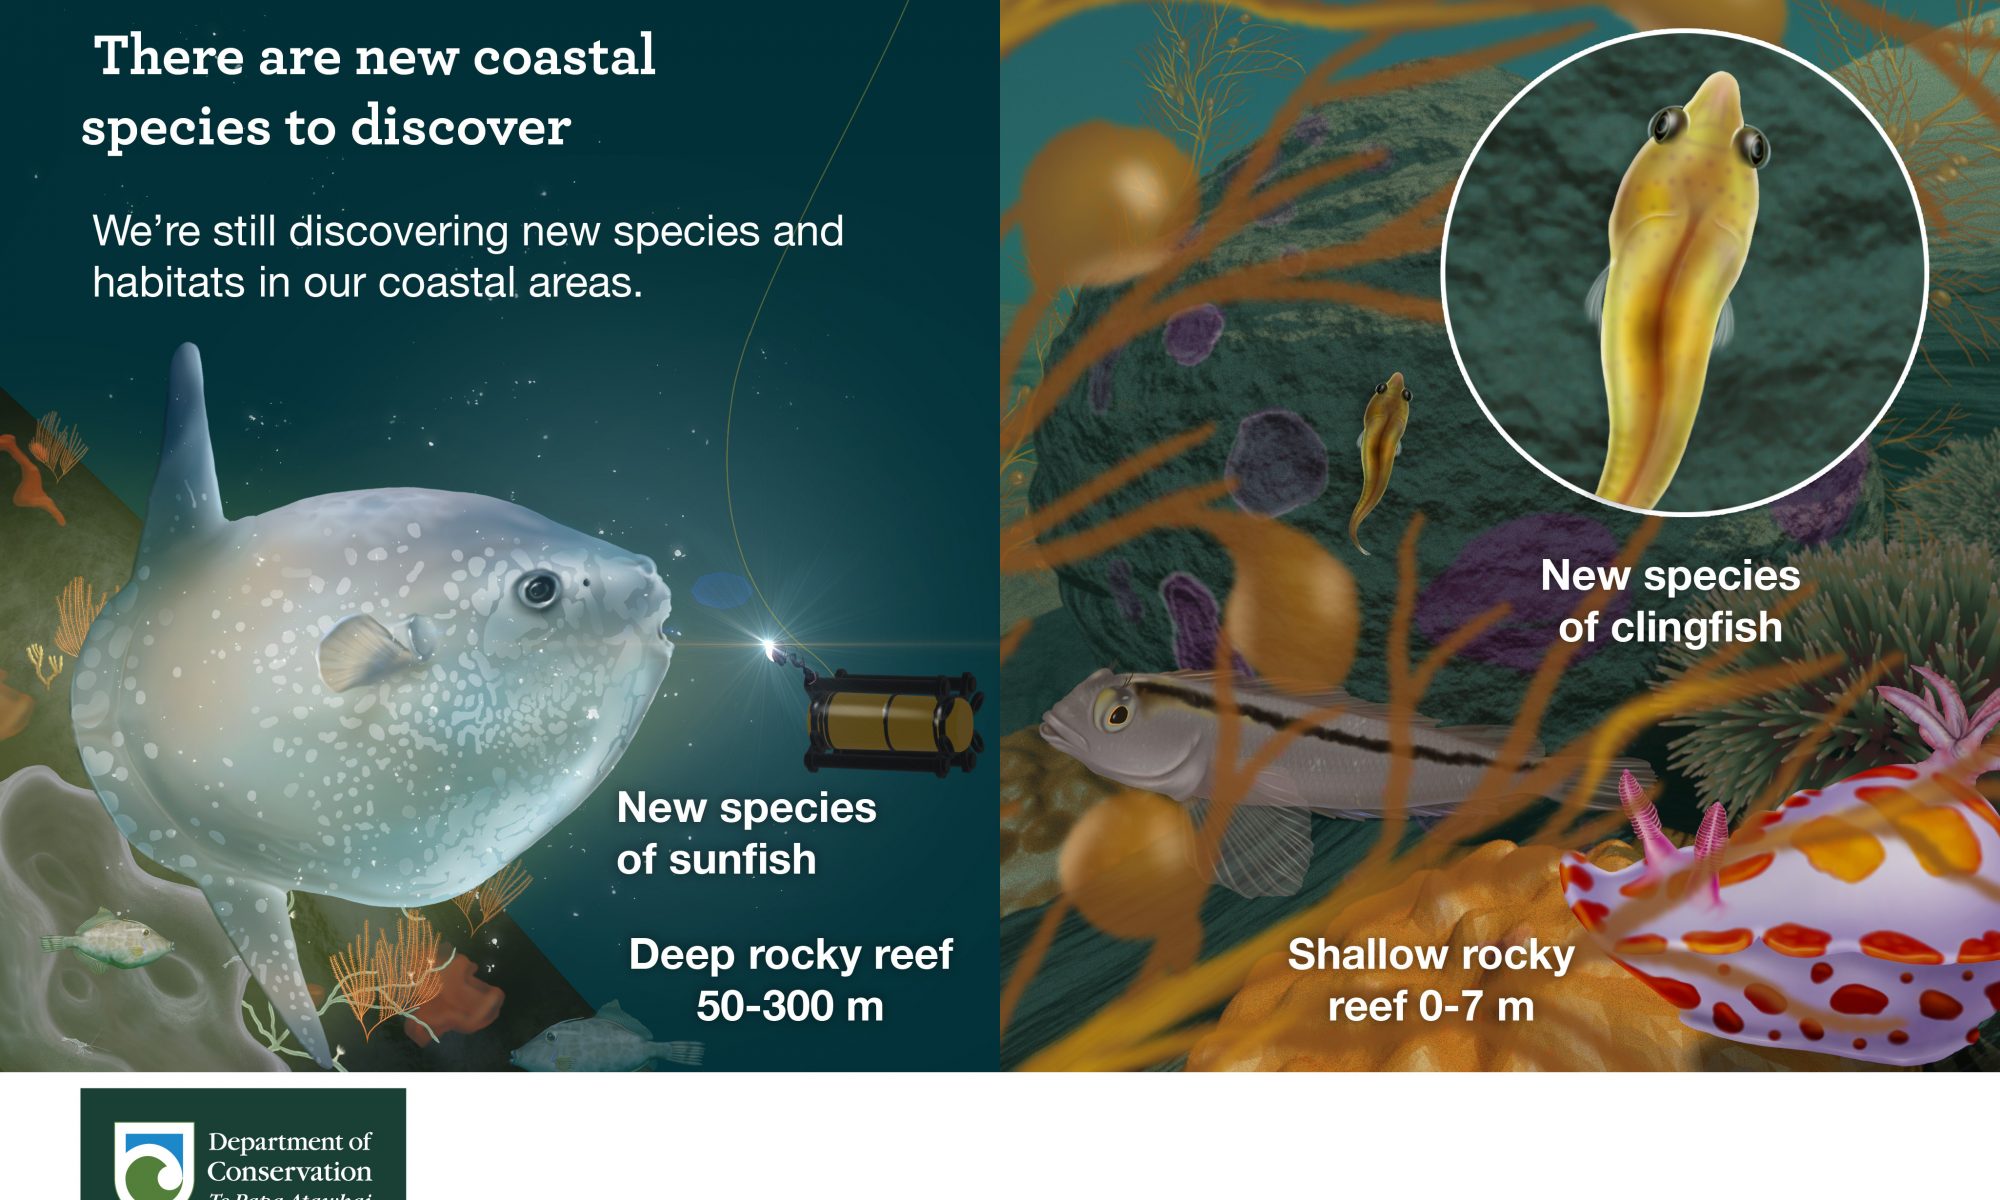
Last year I made a lot of graphics for the Department of Conservation’s awesome Marine Ecosystems Team. I have published them all here, as a reference. They are being used like this and this. UPDATE May 2022 more here.


Mostly just stuff I am doing to help the planet
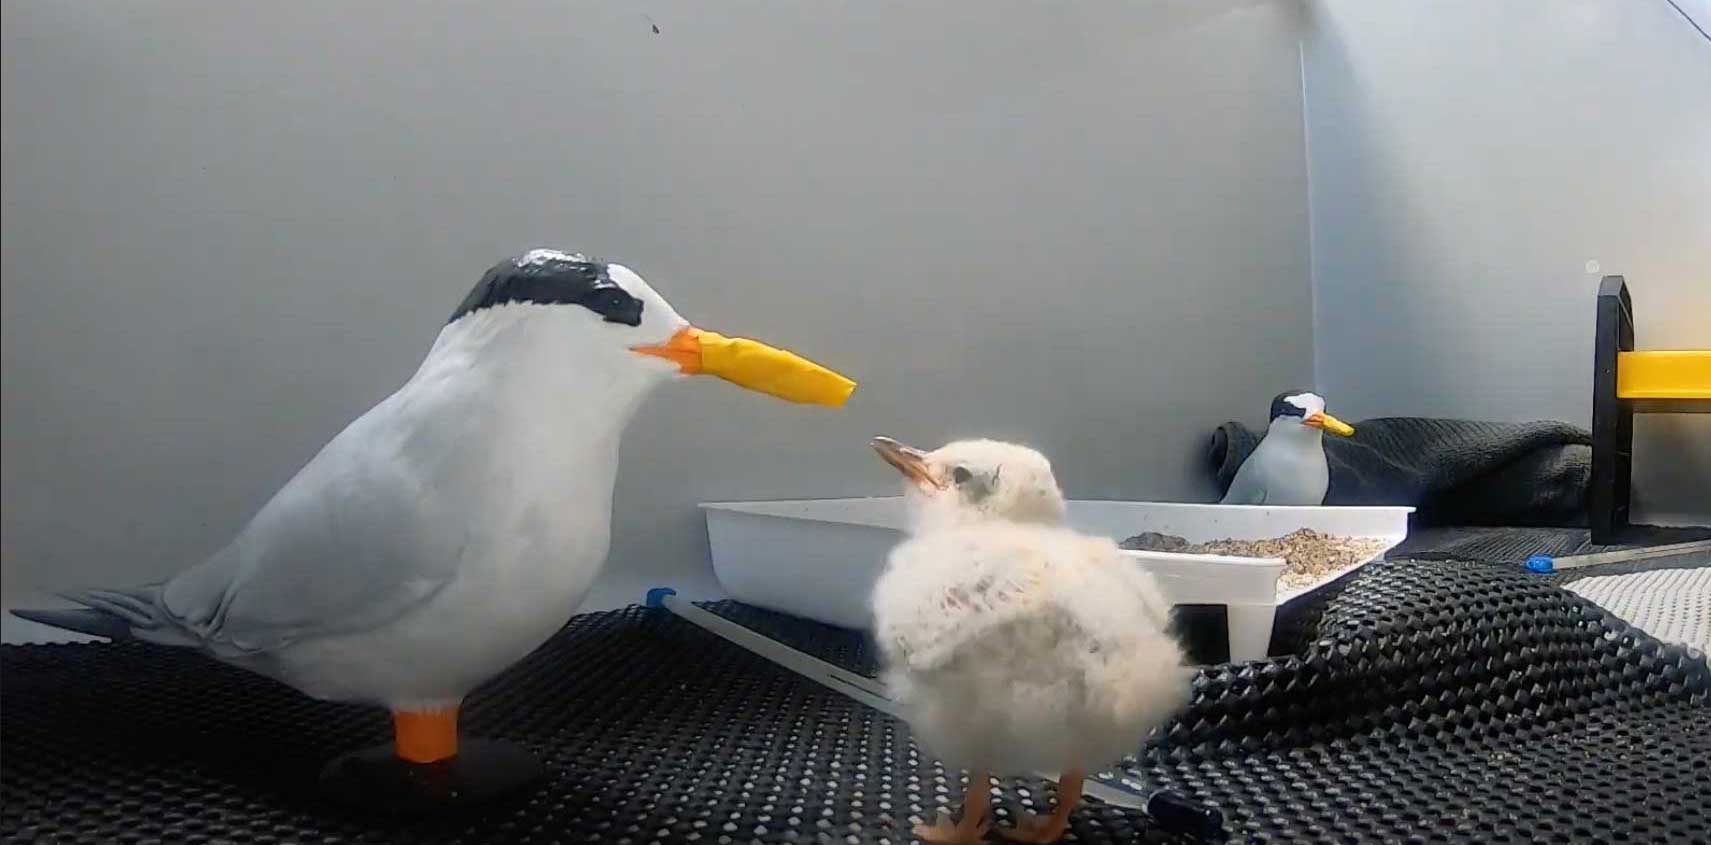
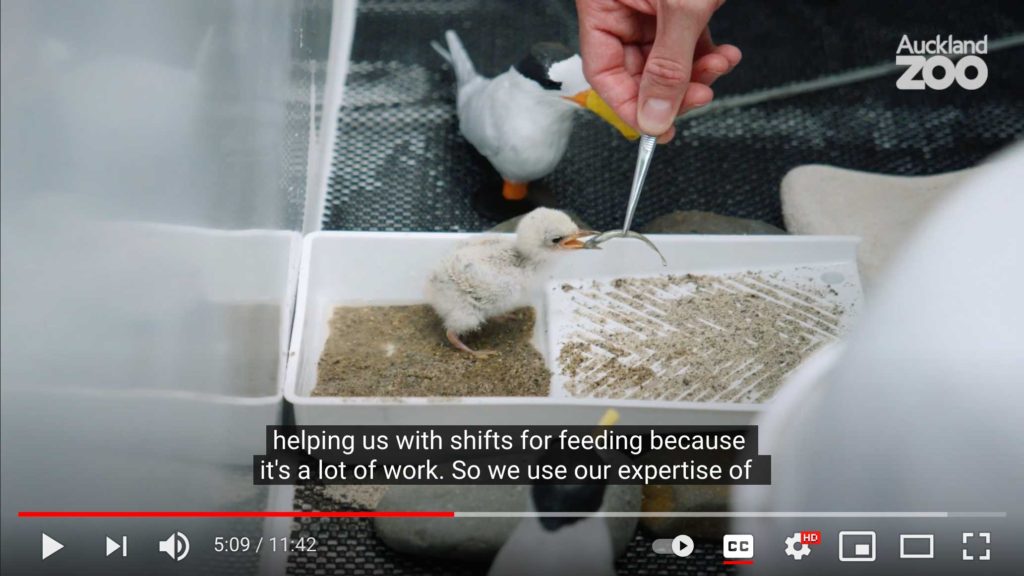
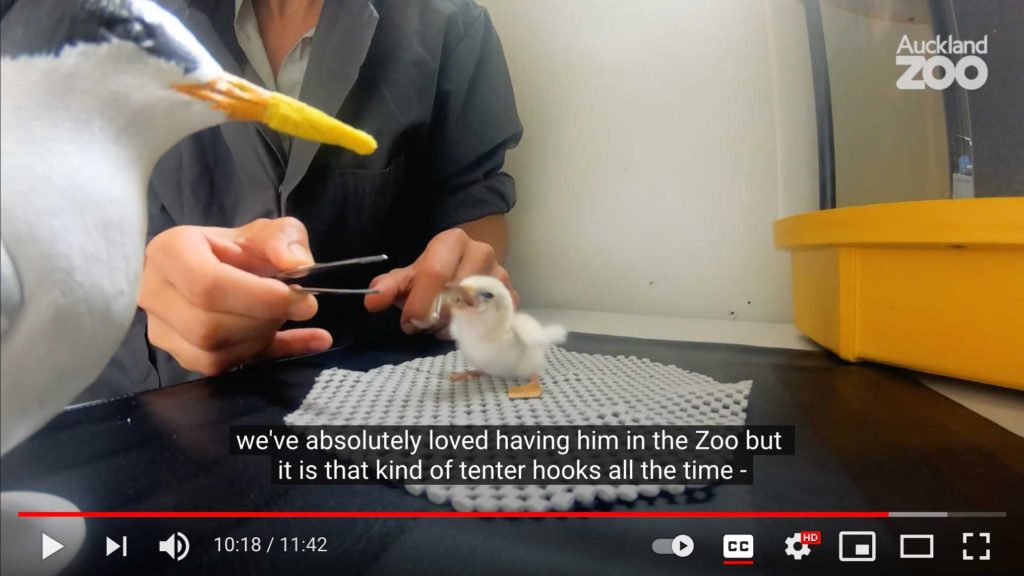
In December 2020 I jumped at the chance to help the Department of Conservation and Auckland Zoo with New Zealand’s most endangered bird. I provided 3D printed fairy tern models (that were designed for use as decoys) to Zoo staff who hand reared a chick through to fledging. A soft yellow tape was wrapped around the models beaks to make sure the valuable chick did not injure itself. The models stayed with the chick to its aviary bach until it learnt to fly and feed for itself.


In November I sent this letter to Auckland Councils Environment and Climate Change Committee along with this report. This morning I was invited to present to the Mayor of Auckland and the committee (presentation here) the report and letter were well received and I answered many questions from engaged Councillors. A response is being drafted.
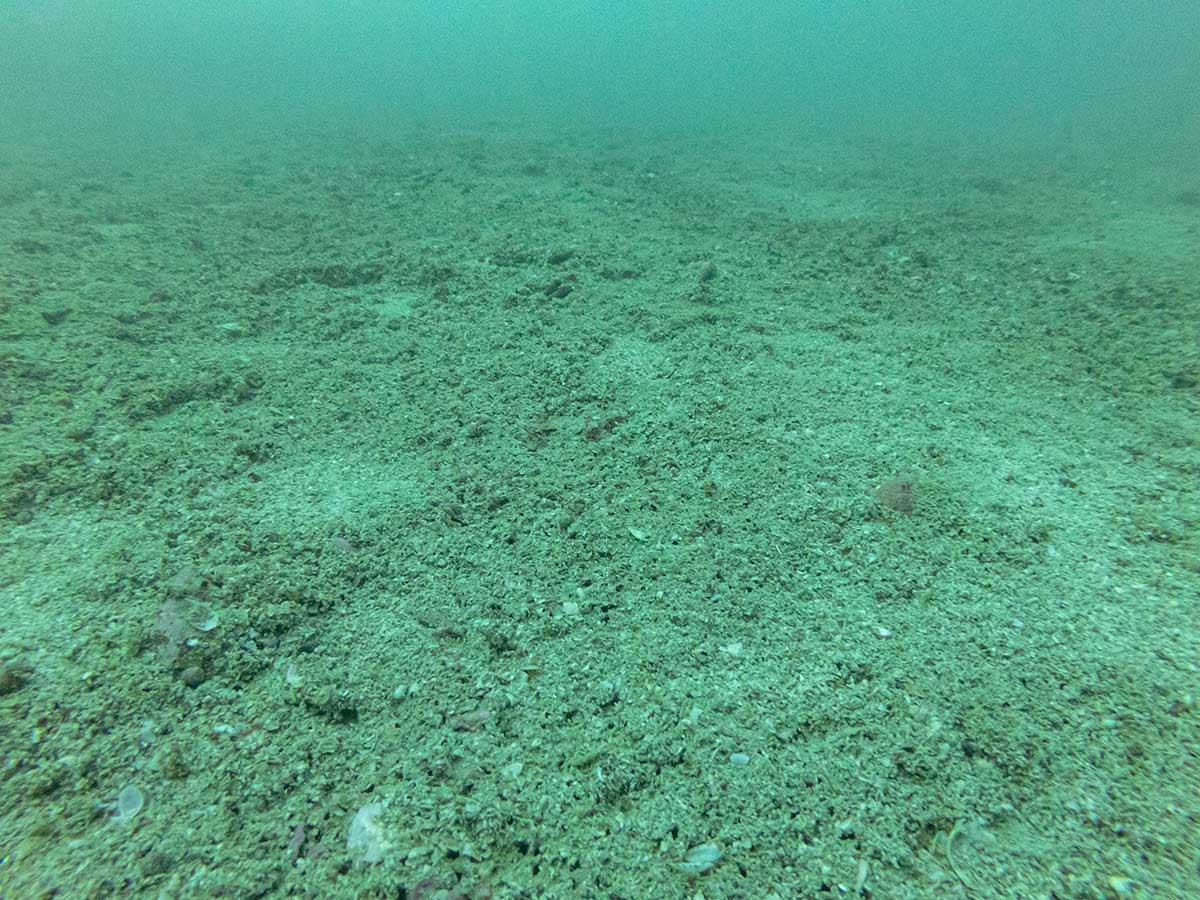
I was pleased to read about Dr Mark Morrison’s 2020 discovery of tubeworms colonies in the Hauraki Gulf. The Marine Park has been heavily impacted by bottom impact fishing and epi-benthic biogenic habitat is now hard to find. I wanted to see what the tubeworm colonies looked like and how the wildlife differed from degraded seafloor.
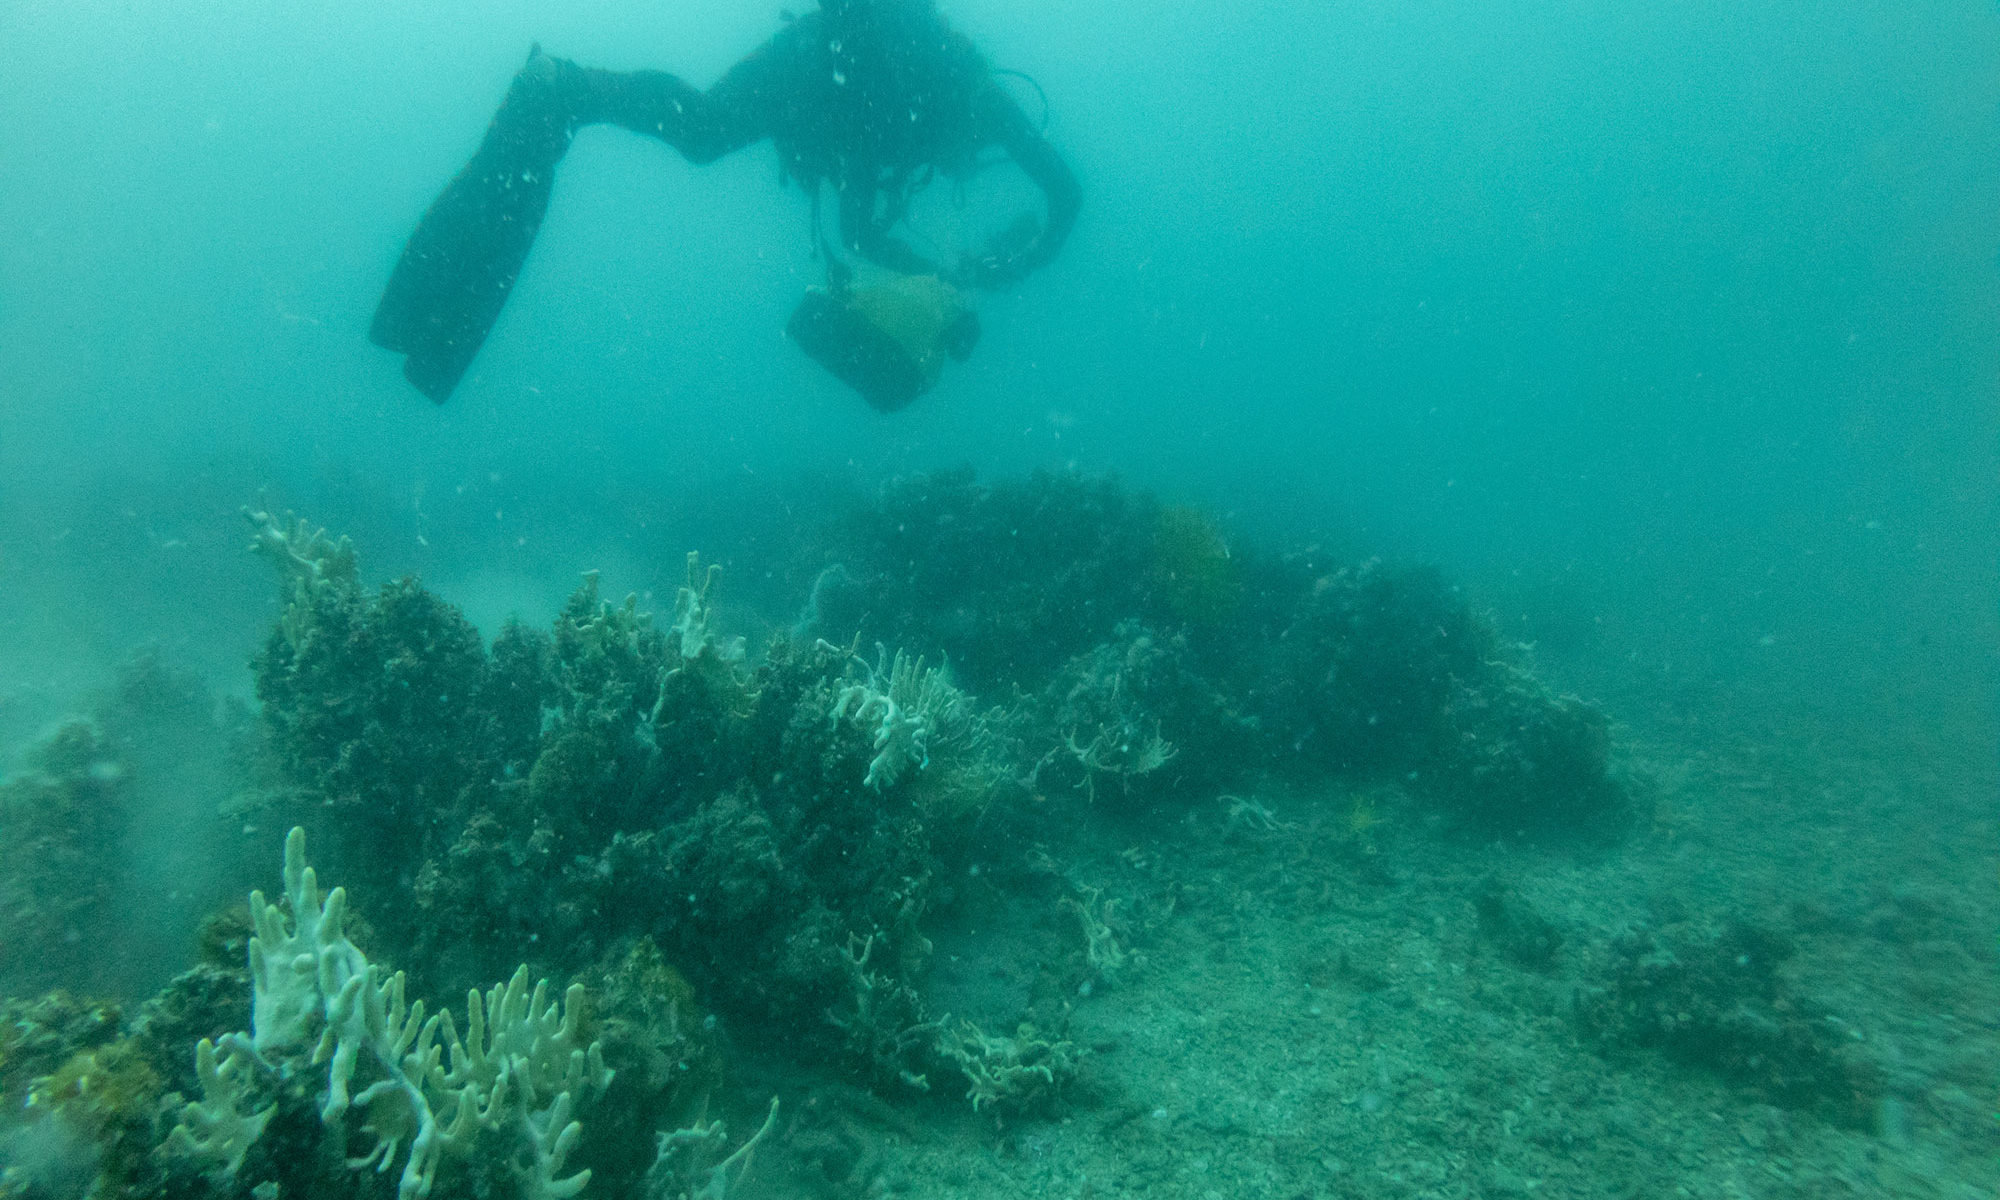
I was therefore very excited to be invited on an expedition to inspect some tubeworm mounds discovered by Shane Kelly and Carina Sim-Smith near Moturua Island. They were relatively deep at about 25 meters whereas Mark Morrison’s ones were in the 12-22 meter range. The conditions were perfect with no wind and clear skies. We descended very quickly into the dark as we knew at that depth we would only have about half an hour to explore the area.
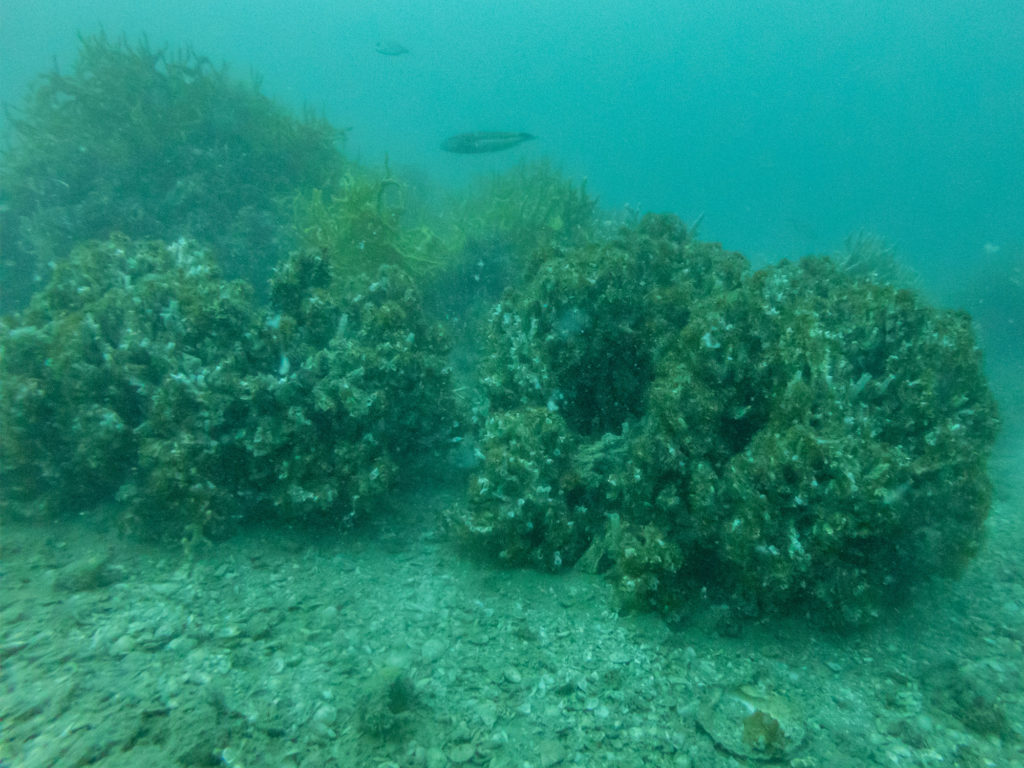
I was stunned at the size of the mounds, they rose up to nearly a meter from the seafloor (much taller than any shellfish bed) and reminded me of coral reefs. Tubeworms grow in a similar way to coral, layering their calcareous skeleton homes upon each other as they filter feed and grow upwards. And just like some corals when I got about half a meter away from the tubeworms they retracted their red tentacles in a Mexican wave across the mound, it was really beautiful and I should have made a video of it.
The diversity was incredible, I was amazed at the amount of filter feeding colonial epifauna growing on the mounds. I wondered if the sponges, ascidians, anemones (which are also filter feeders) were competing with the tubeworms or if the relationships were commensal.
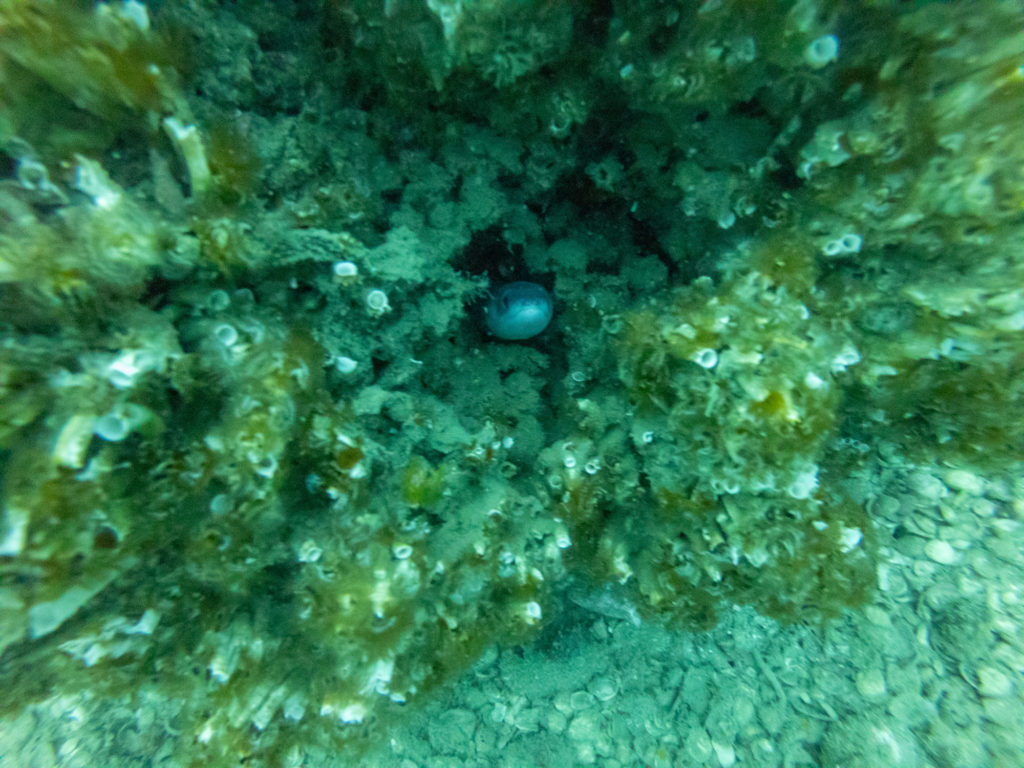
I don’t know the surrounding area but I was surprised to see so many fish including a young sandagers wrasse. This conger eel living in the mounds was a real highlight and I wish I had gotten a better photo. Goatfish were the most abundant fish species.
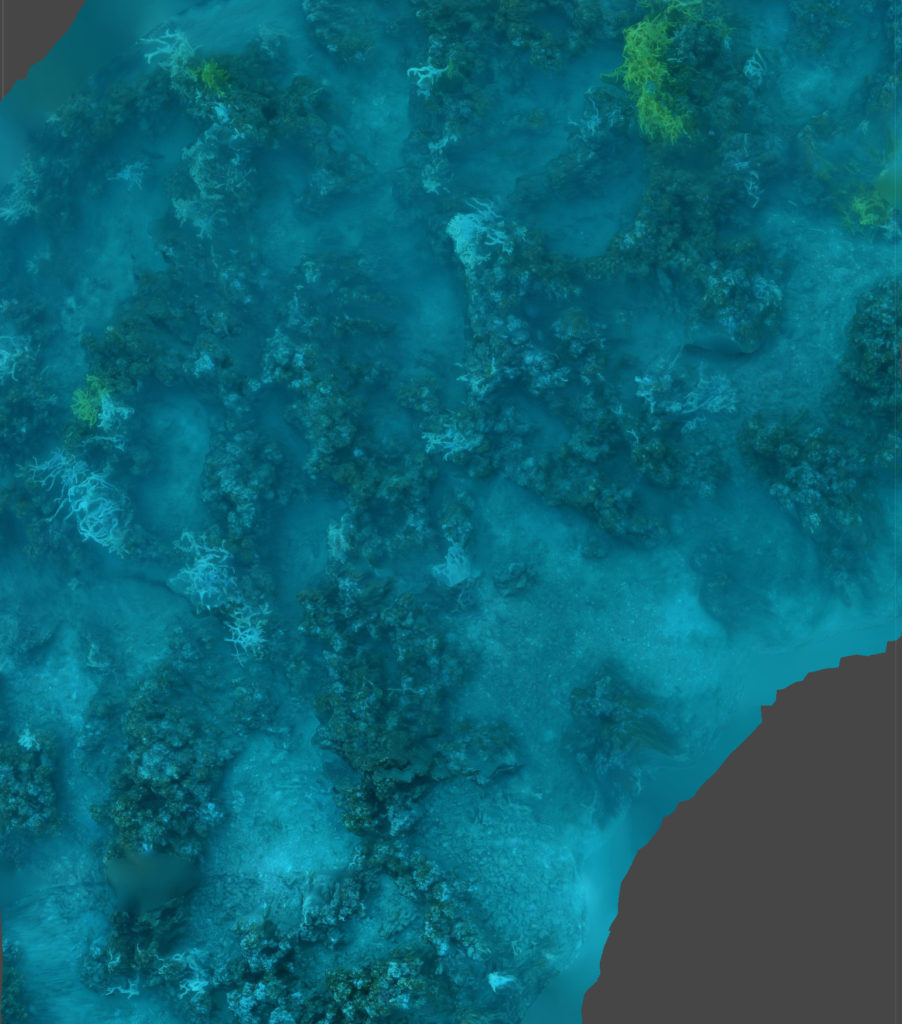
While the scientists collected a few specimens for identification I took two minutes to record a video which I later converted into an orthomoasic map using this technique (which I am still polishing). The map revealed an interesting pattern similar to that made by restored mussels as they clump together over time. It would be good to validate it by mapping more filter feeding structures.
The fragile mounds are easily damaged by dredges and trawlers, it’s likely that fear of catching gear on anchors from the adjacent mussel farm has protected the beds. The experience has me wondering what a huge protected tubeworm colony might look like, and how can we make more of these incredible structures.
UPDATE: July 2021. I was able to check our Dr Morrisons ones. Video from GoPro attached to my camera here.
I have spent a fair bit of time thinking about how citizen scientists can measure the health of their local streams using Macroinvertebrate Community Index (WIMP & SHMAK) and the index of biotic integrity (IBI) for New Zealand fish. The great thing about using stream life to measure stream health is that the animals act as 24/7 sensors that measure any of the countless pollutants that harm life. The problem with it is that finding and more importantly identifying species involves disrupting them.
eDNA (environmental DNA) sampling solves this by measuring the presence of stream life base on the tiny fragments all life constantly erode into water. Wilderlab have set up a testing system with relatively cheap kits available for citizen scientists. I found it easy to use on my local stream (which is very degraded). I am really excited about this technology, especially as the price comes down and results are benchmarked against existing stream health Indices.

This artificial shag roost in Hobson Bay was constructed by Auckland Council to mitigate the effects of a boardwalk being constructed next to an existing shag roost. Nesting materials and a plywood decoy has been added but the birds are yet to show interest in it.

As communities get increasingly worried about the declining quality of their waterways there is more interest stream health assessments. I am a huge fan of the Waicare Invertebrate Monitoring Protocol (WIMP) which is simple enough that school students can use it. However the Waicare programme has been largely defunded by Auckland Council and there is no way for the public to share WIMP data. NIWA and Federated Farmers of New Zealand have put together https://nzwatercitizens.co.nz/ based on the New Zealand Stream Health Monitoring and Assessment Kit (SHMAK). It is great but incredibly hard to use, the manual is horrific. I believe this is being addressed but will take years. To help, the science learning hub has made this great guide for teachers and students. NIWA have put together some videos. They are not published together anywhere online so I have posted the list below:
I really like this list of alternative words for environmental terms, offered by George Monbiot & Ralph Steadman. I have rebuilt it in HTML with some additions and deletions, I plan to evolve it over time.
| Existing terms | What’s wrong with it | Alternative terms |
| Environment | Cold, technical Seen as seperate | The natural world |
| Global warming | Warm sounds pleasant | Global overheating |
| Biodiversity | Inaccessible | Wildlife |
| Ecosystem services | Anthropocentric and reductive | Life support systems |
| Nature reserve | ‘reserve’ suggests coldness | Wildlife refuge |
| Habitat destruction Deforestation Biodiversity loss | Sounds like they are happening to themselves | Ecocide |
| Conservation | Preserving what little is left rather than rebuilding living systems (New Zealand needs a department of Restoration) | Restoration |
| Clean rivers / seas | Sounds too hygienic, is blind to waters as habitats | Thriving rivers / seas |
| Fossil fuels | Suggests redundancy | Dirty fuels |
| Sustainable development | Green growth is an oxymoron | Regenerative development |
| Photopollution | Too technical, doesn’t indicate what is being impacted | Ecological light pollution |
| Stormwater | Suggests that the water is unwanted, unnecessary or unsavoury | Rainwater |
| MARINE | ||
| Fish stocks | Suggests fish are here to serve us | Wild fish populations |
| Biofoul, foul, foul ground | Suggests there is something ugly about biogenic habitats | Sea life, seafloor life, benthic epifauna |
| Fishing | Casual everyday activity | Killing native wildlife |
| Bait fish | Implies the fish exist to be bait | Small schooling fish / forage fish / small pelagic fish / shoaling fish |
| Bait ball | Implies the fish exist to be bait | Tight ball of fish |
| Seaweeds | Pest connotations | Ocean plants |
| Mobile bottom contact fishing | Implies a light touch | (Mobile) Bottom impact fishing |

Marine restoration is a lazy business. All you have to do is stop fishing an area and marine ecosystems heal themselves. However this is not the case with green-lipped mussels in New Zealand.
100’s of square kilometres of sub-tidal mussel beds were fished to extinction in each harbour around New Zealand.

The industry collapsed and more than half a century later they have not returned. In the Hauraki Gulf there are a few places you can still find Green-lipped mussels. You would think that these places would be deep under the ocean (Green-lipped mussels have been found at 50m deep), but they are not.
Most are in the intertidal zone on rocky shores. Here there is usually a gradient with mussels thin higher up and getting thicker towards the low tide mark where the abruptly stop. I have asked several local experts and no one has a solid answer why they stop so abruptly.
As we spend 100’s of thousands of dollars restoring sub-tidal beds maybe the key to unlocking a lazier (and cheaper) solution is staring us in the face. Here are some thoughts on why the line exists:
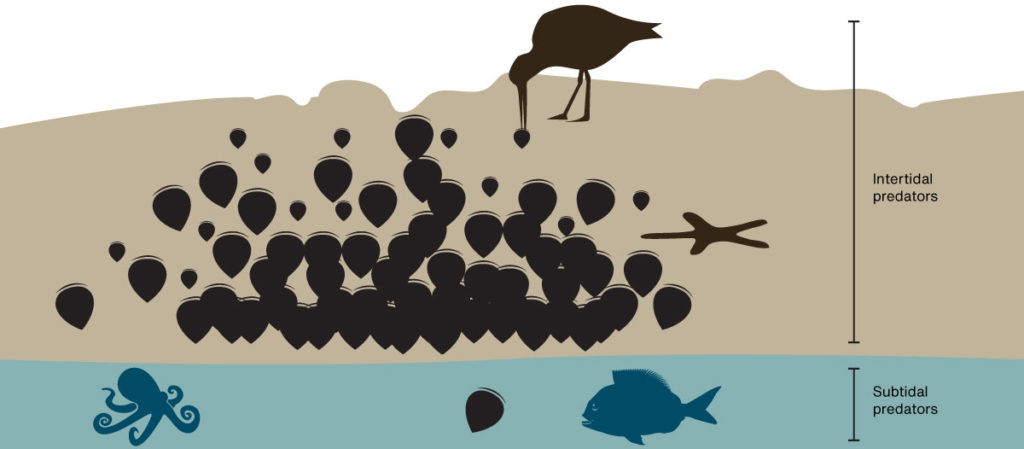
Or maybe like a lot of things in biology it’s a mixture of the above factors. As we are slowly losing our intertidal mussel beds it might be wise to set up a long-term monitoring project that might solve this mystery and inspire lazier restoration methods.

I have 1,612 verified observations on iNaturalist between Auckland and Whangarei documenting 552 species (mostly invertebrates) covering forest, freshwater, intertidal and marine habitats. I don’t take many photographs of plants. Of these observation 96 or 17% of species were introduced. Here is a break down showing areas where I have found more or less introduced species:
| Hauturu | Aotea | Tawharanui | East Auckland | Waitakeres | Hunua Ranges | Rangitoto / Motutapu / Motuihe | Motukorea | Mungatapere | |
| Observations | 206 | 149 | 141 | 197 | 77 | 94 | 71 | 33 | 159 |
| Species | 86 | 84 | 86 | 120 | 57 | 64 | 52 | 25 | 83 |
| Introduced | 6 | 12 | 8 | 35 | 1 | 4 | 11 | 4 | 9 |
| Percent introduced | 7 | 14 | 9 | 29 | 2 | 6 | 21 | 16 | 11 |
I expected the restored and protected islands in the Hauraki Gulf to have a smaller percent of introduced species. I think the high number of introduced species (compared to the Waitakeres and the Hunua Ranges) reflects the islands farmed history with islands like Motukorea and Motutapu still dominated by kikuyu. The larger and older the forest the more indigenous biodiversity.